# 监控报告系统运行状况
每一部分必须同时监控
内容包括吞吐量 、反应时间、使用率等
提前发现问题
进行服务器性能调整前,知道调整什么
找出系统的瓶颈在什么地方
监控资源类别
公开数据
Web、FTP、SSH、数据库等应用服务
TCP 或 UDP 端口
私有数据
CPU、内存、磁盘、网卡流量等使用信息
用户、进程等运行信息
Cacti
基于 SNMP 协议的监控软件,强大的绘图能力
Nagios
基于 Agent 监控,强大的状态检查与报警机制插件极多,自己写监控脚本潜入到 Nagios 非常方便
Zabbix
基于多种监控机制,支持分布式监控
# zabbixZabbix 是一个高度集成的监控解决方案
可以实现企业级的开源分布式监控
Zabbix 通过 C/S 模式采集监控数据
Zabbix 通过 B/S 模式实现 Web 管理
监控服务器
监控服务器可以通过 SNMP 或 Agent 采集数据数据
可以写入 MySQL、Oracle 等数据库中服务器
使用 LNMP 实现 web 前端的管理
被监控主机
被监控主机需要安装 Agent
常见的网络设备一般支持 SNMP
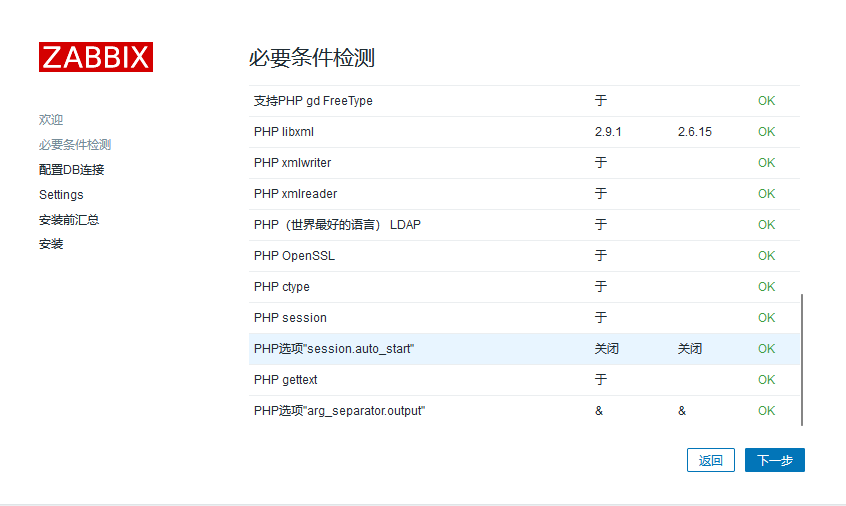
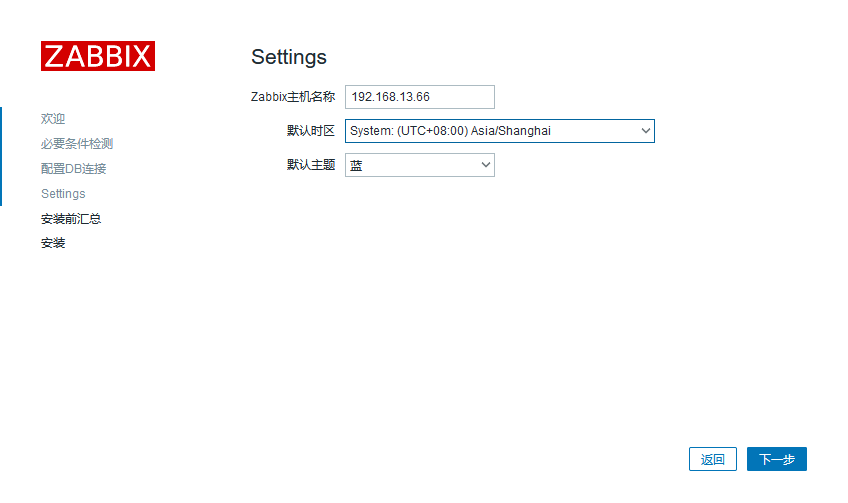
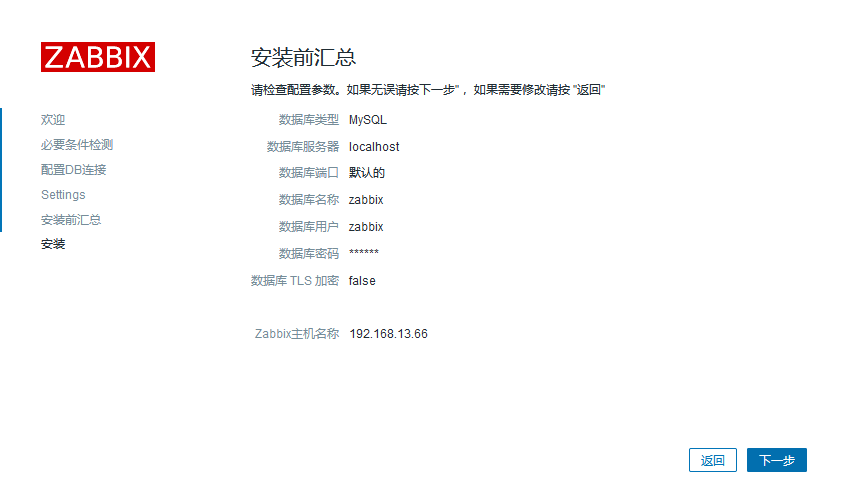
# 安装1 2 3 4 5 6 7 8 9 10 11 12 13 14 15 16 17 18 19 20 21 22 23 24 25 26 27 28 29 30 31 32 33 34 35 36 37 38 39 40 41 42 43 44 45 46 47 48 49 50 51 52 53 54 55 56 57 58 59 60 61 62 63 64 65 66 67 68 69 70 71 72 73 74 75 76 77 78 79 80 81 82 83 84 85 86 87 88 89 90 91 92 93 94 95 96 97 98 99 100 101 102 103 104 105 106 107 108 109 110 111 112 113 114 115 116 117 118 119 120 121 122 123 124 125 126 127 128 129 130 131 132 133 yum install openssl* gd-* pcre* zlib* wget vim -y yum install php php-mysql mariadb mariadb-devel mariadb-server php-fpm -y wget "http://nginx.org/download/nginx-1.25.3.tar.gz" tar xzvf nginx-1.25.3.tar.gz cd nginx-1.25.3/ ./configure --prefix=/etc/nginx --sbin-path=/usr/sbin/nginx --modules-path=/usr/lib/nginx/modules --conf-path=/etc/nginx/nginx.conf --error-log-path=/var/log/nginx/error.log --http-log-path=/var/log/nginx/access.log --pid-path=/var/run/nginx.pid --lock-path=/var/run/nginx.lock --http-client-body-temp-path=/var/cache/nginx/client_temp --http-proxy-temp-path=/var/cache/nginx/proxy_temp --http-fastcgi-temp-path=/var/cache/nginx/fastcgi_temp --http-uwsgi-temp-path=/var/cache/nginx/uwsgi_temp --http-scgi-temp-path=/var/cache/nginx/scgi_temp --user=nginx --group=nginx --with-compat --with-file-aio --with-threads --with-http_addition_module --with-http_auth_request_module --with-http_dav_module --with-http_flv_module --with-http_gunzip_module --with-http_gzip_static_module --with-http_mp4_module --with-http_random_index_module --with-http_realip_module --with-http_secure_link_module --with-http_slice_module --with-http_ssl_module --with-http_stub_status_module --with-http_sub_module --with-http_v2_module --with-mail --with-mail_ssl_module --with-stream --with-stream_realip_module --with-stream_ssl_module --with-stream_ssl_preread_module --with-cc-opt='-g -O2 -fdebug-prefix-map=/data/builder/debuild/nginx-1.25.3/debian/debuild-base/nginx-1.25.3=. -fstack-protector-strong -Wformat -Werror=format-security -Wp,-D_FORTIFY_SOURCE=2 -fPIC' --with-ld-opt='-Wl,-Bsymbolic-functions -Wl,-z,relro -Wl,-z,now -Wl,--as-needed -pie' make && make install useradd nginx -s /sbin/nologin -M mkdir -p /var/cache/nginx/client_temp nginx vim nginx.conf location ~ \.php$ { root html; fastcgi_pass 127.0.0.1:9000; fastcgi_index index.php; #fastcgi_param SCRIPT_FILENAME /scripts$fastcgi_script_name; include fastcgi.conf; } systemctl start mariadb.service systemctl start php-fpm.service yum -y install net-snmp net-snmp-devel curl curl-devel libxml2 libevent libevent-devel rpm -Uvh https://repo.zabbix.com/zabbix/6.0/rhel/7/x86_64/zabbix-release-6.0-4.el7.noarch.rpm yum clean all yum install zabbix-agent systemctl restart zabbix-agent systemctl enable zabbix-agent wget "https://cdn.zabbix.com/zabbix/sources/stable/6.0/zabbix-6.0.26.tar.gz" tar xzvf zabbix-6.0.26.tar.gz cd zabbix-6.0.26/ ./configure --prefix=/application/zabbix --with-mysql --with-net-snmp --with-libcurl --enable-server --enable-agent --enable-proxy --with-libxml2 make install ln -s /application/zabbix/sbin/* /usr/local/bin/ ln -s /application/zabbix/sbin/* /usr/local/sbin/ mysql -uroot -p create database zabbix character set utf8 collate utf8_bin; // 一定要用utf8_bin不然下面安装的时候会有报错 grant all privileges on zabbix.* to zabbix@localhost identified by 'zabbix'; cd /root/zabbix-6.0.26/database/mysql mysql -uzabbix -pzabbix zabbix < schema.sql mysql -uzabbix -pzabbix zabbix < images.sql mysql -uzabbix -pzabbix zabbix < data.sql mysql -uzabbix -pzabbix zabbix < double.sql mysql -uzabbix -pzabbix zabbix < history_pk_prepare.sql vim /application/zabbix/etc/zabbix_server.conf LogFile=/var/log/zabbix_server.log DBPassword=zabbix -------- cat > /usr/lib/systemd/system/zabbix-server.service << EOF [Unit] Description=Zabbix Server with MySQL DB After=syslog.target network.target mysqld.service [Service] Type=simple ExecStart=/usr/local/sbin/zabbix_server -f User=zabbix [Install] WantedBy=multi-user.target EOF -------- systemctl daemon-reload touch /var/log/zabbix_server.log chown zabbix.zabbix /var/log/zabbix_server.log systemctl restart zabbix-server.service cd /etc/nginx/html/ mkdir zabbix cp /root/zabbix-6.0.26/ui/* /etc/nginx/html/zabbix/ -ar chown -R nginx:nginx /etc/nginx/html/zabbix/ // 显示Minimum required PHP version is 7.2.5. 的解决方案 yum remove php* -y curl -o /etc/yum.repos.d/CentOS-Base.repo http://mirrors.aliyun.com/repo/Centos-7.repo yum install -y epel-release rpm -Uvh https://mirror.webtatic.com/yum/el7/webtatic-release.rpm yum -y install php72w php72w-cli php72w-common php72w-devel php72w-embedded php72w-gd php72w-mbstring php72w-pdo php72w-xml php72w-fpm php72w-mysqlnd php72w-opcache php72w-ldap php72w-bcmath systemctl enable --now php-fpm // 下载速度慢的解决方案 https://www.cnblogs.com/nocanstillbb/p/12100852.html http://www.manongjc.com/article/105119.html redsocks { local_ip = 0.0.0.0; local_port = 12345; ip = 192.168.13.1; port = 7890; // 本地梯子的端口 type = socks5; } // 修改nginx和php配置文件 vim /etc/php-fpm.d/www.conf user = nginx ; RPM: Keep a group allowed to write in log dir. group = nginx vim /etc/php.ini max_execution_time = 300 # 368行 max_input_time = 600 # 378行 post_max_size = 80M # 656行 date.timezone = Asia/Shanghai # 877行 vim /etc/nginx/nginx.conf http { fastcgi_buffers 8 16k; fastcgi_buffer_size 32k; fastcgi_connect_timeout 300; fastcgi_read_timeout 300; fastcgi_send_timeout 300; } nginx -s reload systemctl restart php-fpm // 访问 http://192.168.13.66/zabbix/setup.php
如果有报错,修改到没有报错
如果数据库连接有报错,一般是字符集错误
1
2
3
4
5
6
7
8
ALTER DATABASE `zabbix` DEFAULT CHARACTER SET utf8 COLLATE utf8_bin; # 找出字符检验集不对的表 SELECT CONCAT("ALTER TABLE ", TABLE_NAME," CONVERT TO CHARACTER SET utf8 COLLATE utf8_bin;") AS ExecuteTheString FROM information_schema.`COLUMNS` WHERE table_schema = "zabbix" AND COLLATION_NAME = "utf8_general_ci"; 复制输出结果,并执行
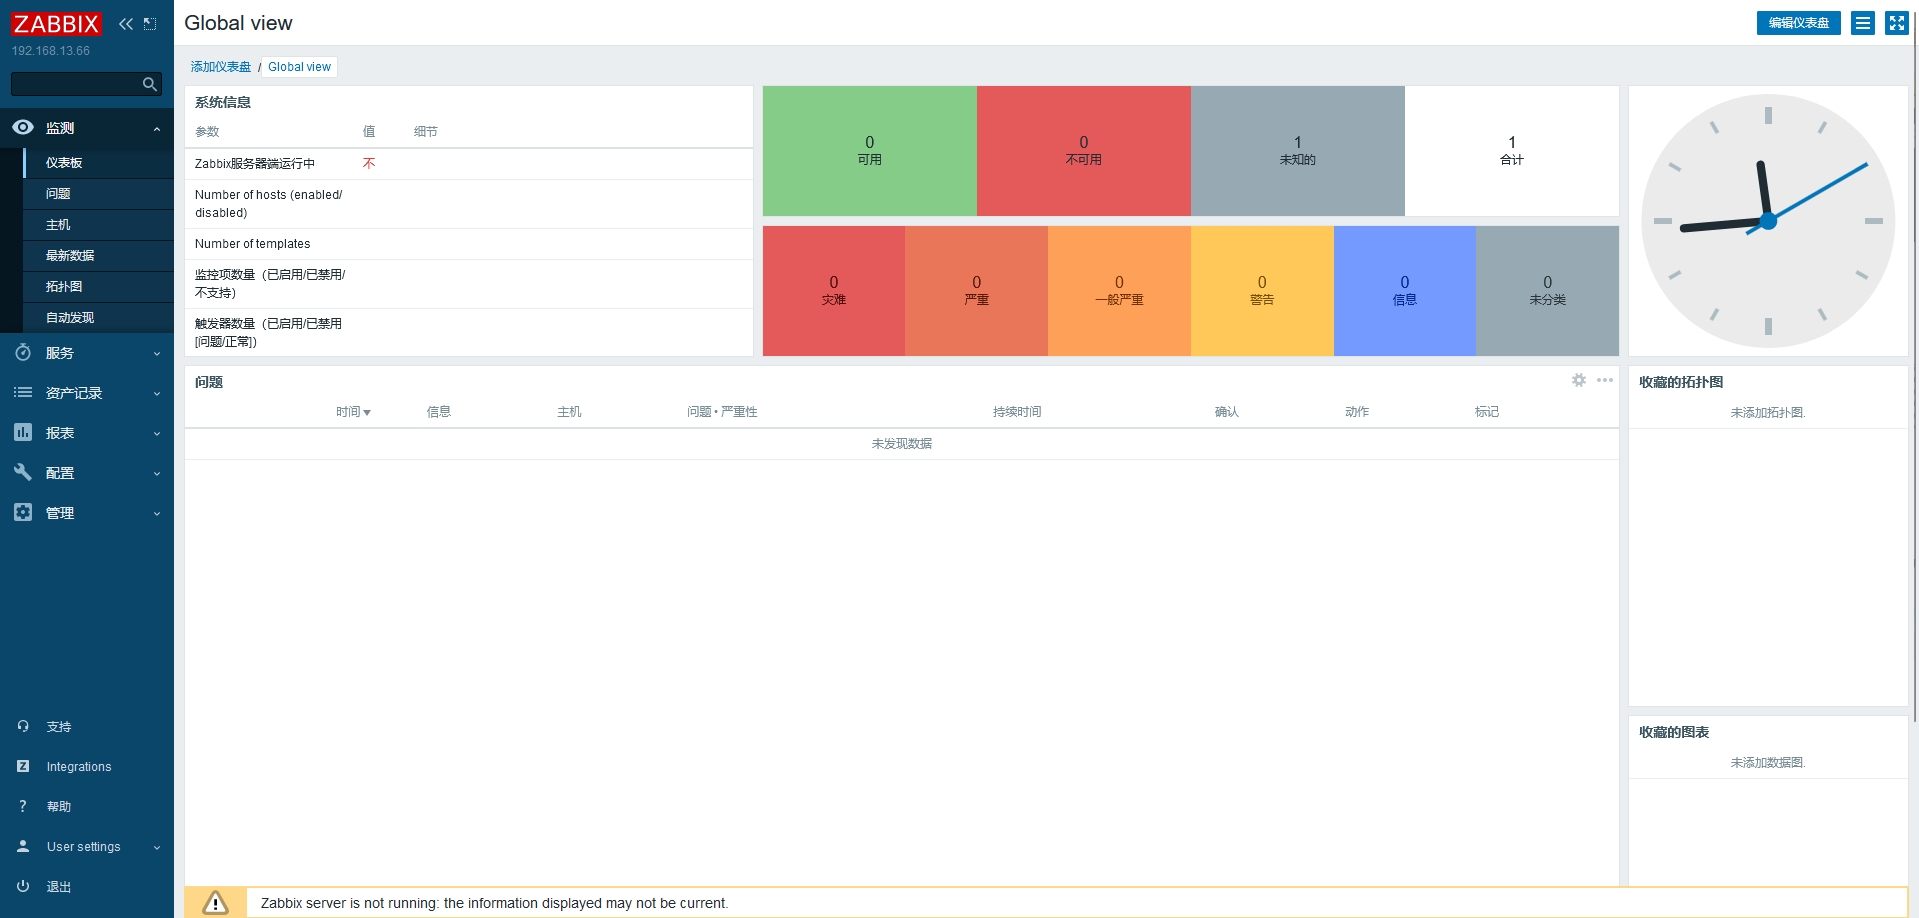
登录 默认情况下用户名是 Admin
1
2
3
4
5
6
7
8
9
10
11
12
13
14
15
16
17
18
19
20
21
22
此时启动zabbix-server会报错,查看zabbix-server.log可以发现mariadb版本不够 1、配置 Mariadb yum源 cat > /etc/yum.repos.d/mariadb.repo << EOF [mariadb] name = MariaDB baseurl = http://mirrors.aliyun.com/mariadb/yum/10.5/centos7-amd64/ gpgkey = http://mirrors.aliyun.com/mariadb/yum/RPM-GPG-KEY-MariaDB gpgcheck = 1 enabled=1 EOF yum install -y mariadb-server mariadb systemctl enable --now mariadb mysql_secure_installation 分别输入 回车 -> n -> Y (设置root密码,如abc123) -> 后面一路 Y mysql -u root -pabc123 CREATE DATABASE zabbix character set utf8 collate utf8_bin; GRANT all ON zabbix.* TO 'zabbix'@'localhost' IDENTIFIED BY 'zabbix'; GRANT all ON zabbix.* TO 'zabbix'@'%' IDENTIFIED BY 'zabbix'; flush privileges; 导入sql文件和上面操作一样
https://blog.csdn.net/DiKL_Y/article/details/131554359 // 可以直接看这篇,能装的更快
https://www.zabbix.com/download_sources#60LTS
https://blog.csdn.net/qq_27546717/article/details/117808148
1
2
3
4
5
6
7
8
9
10
11
12
13
14
// 关闭服务 [root@localhost ~]# netstat -lntup Active Internet connections (only servers) Proto Recv-Q Send-Q Local Address Foreign Address State PID/Program name tcp 0 0 0.0.0.0:10051 0.0.0.0:* LISTEN 69023/zabbix_server tcp 0 0 127.0.0.1:9000 0.0.0.0:* LISTEN 64013/php-fpm: mast tcp 0 0 0.0.0.0:80 0.0.0.0:* LISTEN 5109/nginx: master tcp 0 0 0.0.0.0:22 0.0.0.0:* LISTEN 749/sshd tcp 0 0 0.0.0.0:12345 0.0.0.0:* LISTEN 65085/./redsocks tcp 0 0 127.0.0.1:25 0.0.0.0:* LISTEN 1054/master tcp6 0 0 :::3306 :::* LISTEN 68783/mariadbd tcp6 0 0 :::22 :::* LISTEN 749/sshd tcp6 0 0 ::1:25 :::* LISTEN 1054/master [root@localhost ~]# kill -9 69023
1
2
3
4
5
6
7
8
9
10
11
// 安装探针 rpm -ivh https://repo.zabbix.com/zabbix/6.0/rhel/7/x86_64/zabbix-release-6.0-4.el7.noarch.rpm sed -i 's#https://repo.zabbix.com#https://mirrors.aliyun.com/zabbix#' /etc/yum.repos.d/zabbix.repo yum install -y zabbix-agent2 systemctl enable --now zabbix-agent2 netstat -lntp | grep 10050 // 修改配置文件 vim /etc/zabbix/zabbix_agent2.conf Server=127.0.0.1,192.168.13.66 ServerActive=192.168.13.66:10051
1
2
3
yum install -y wqy-microhei-fonts cp -f /usr/share/fonts/wqy-microhei/wqy-microhei.ttc /etc/nginx/html/zabbix/assets/fonts/DejaVuSans.ttf 解决乱码
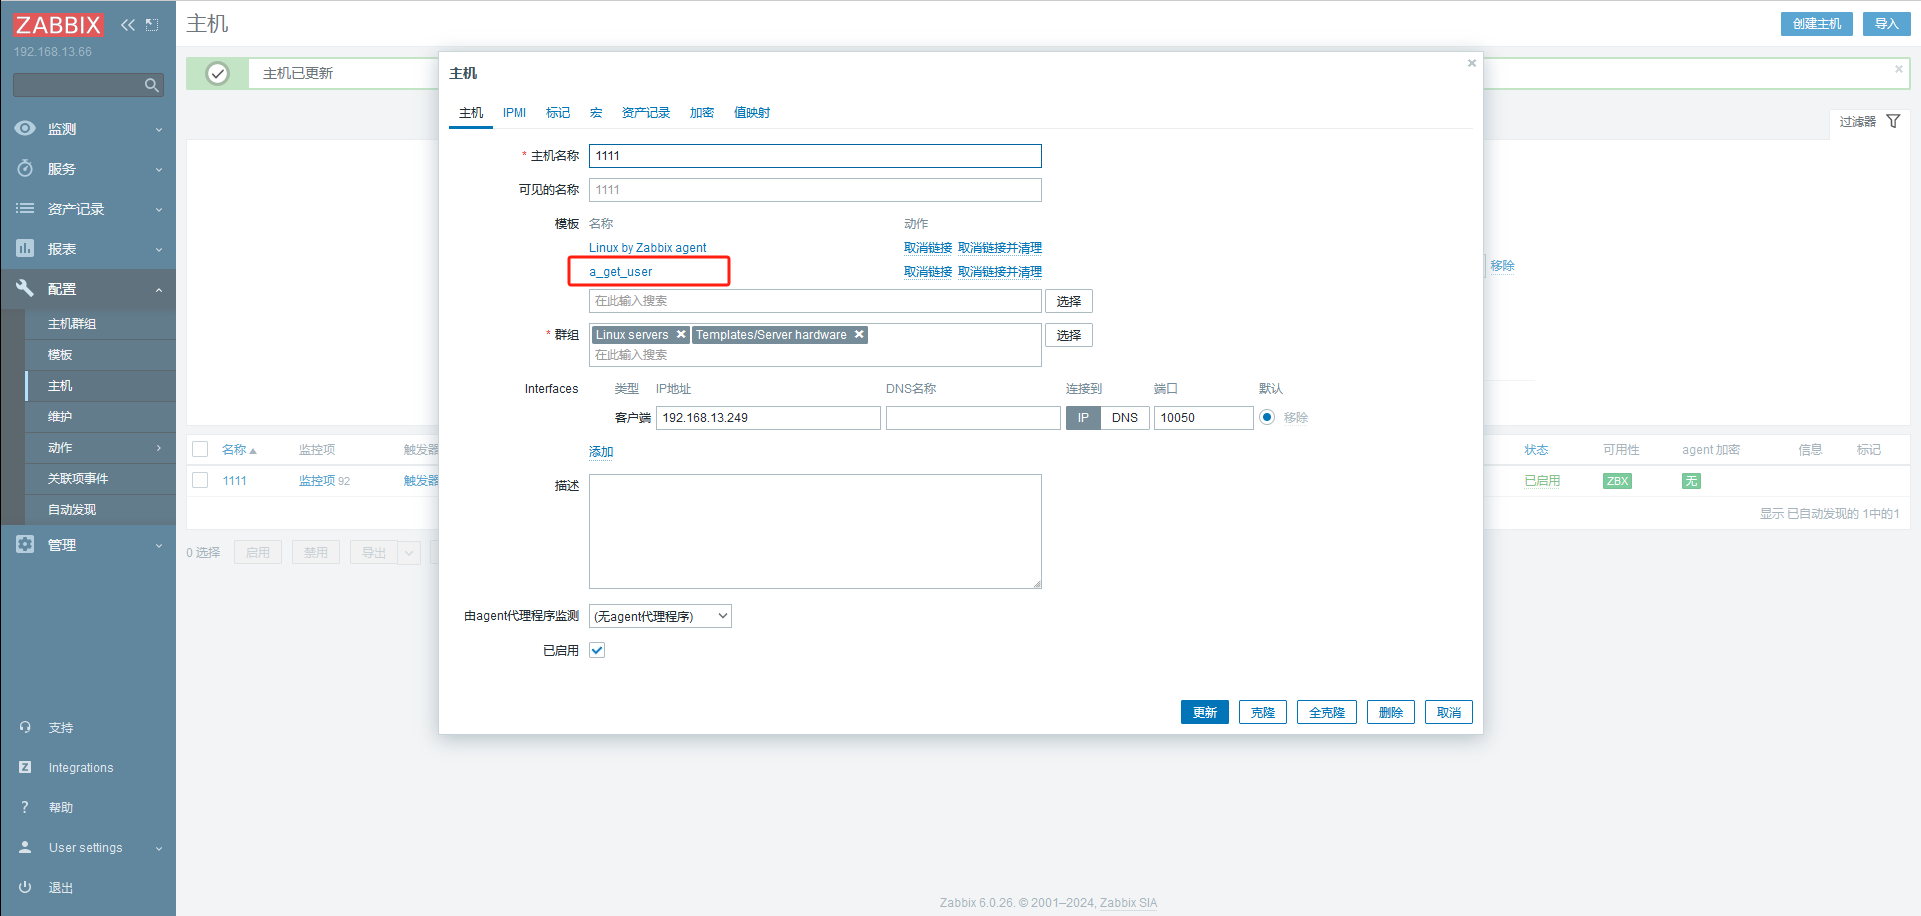
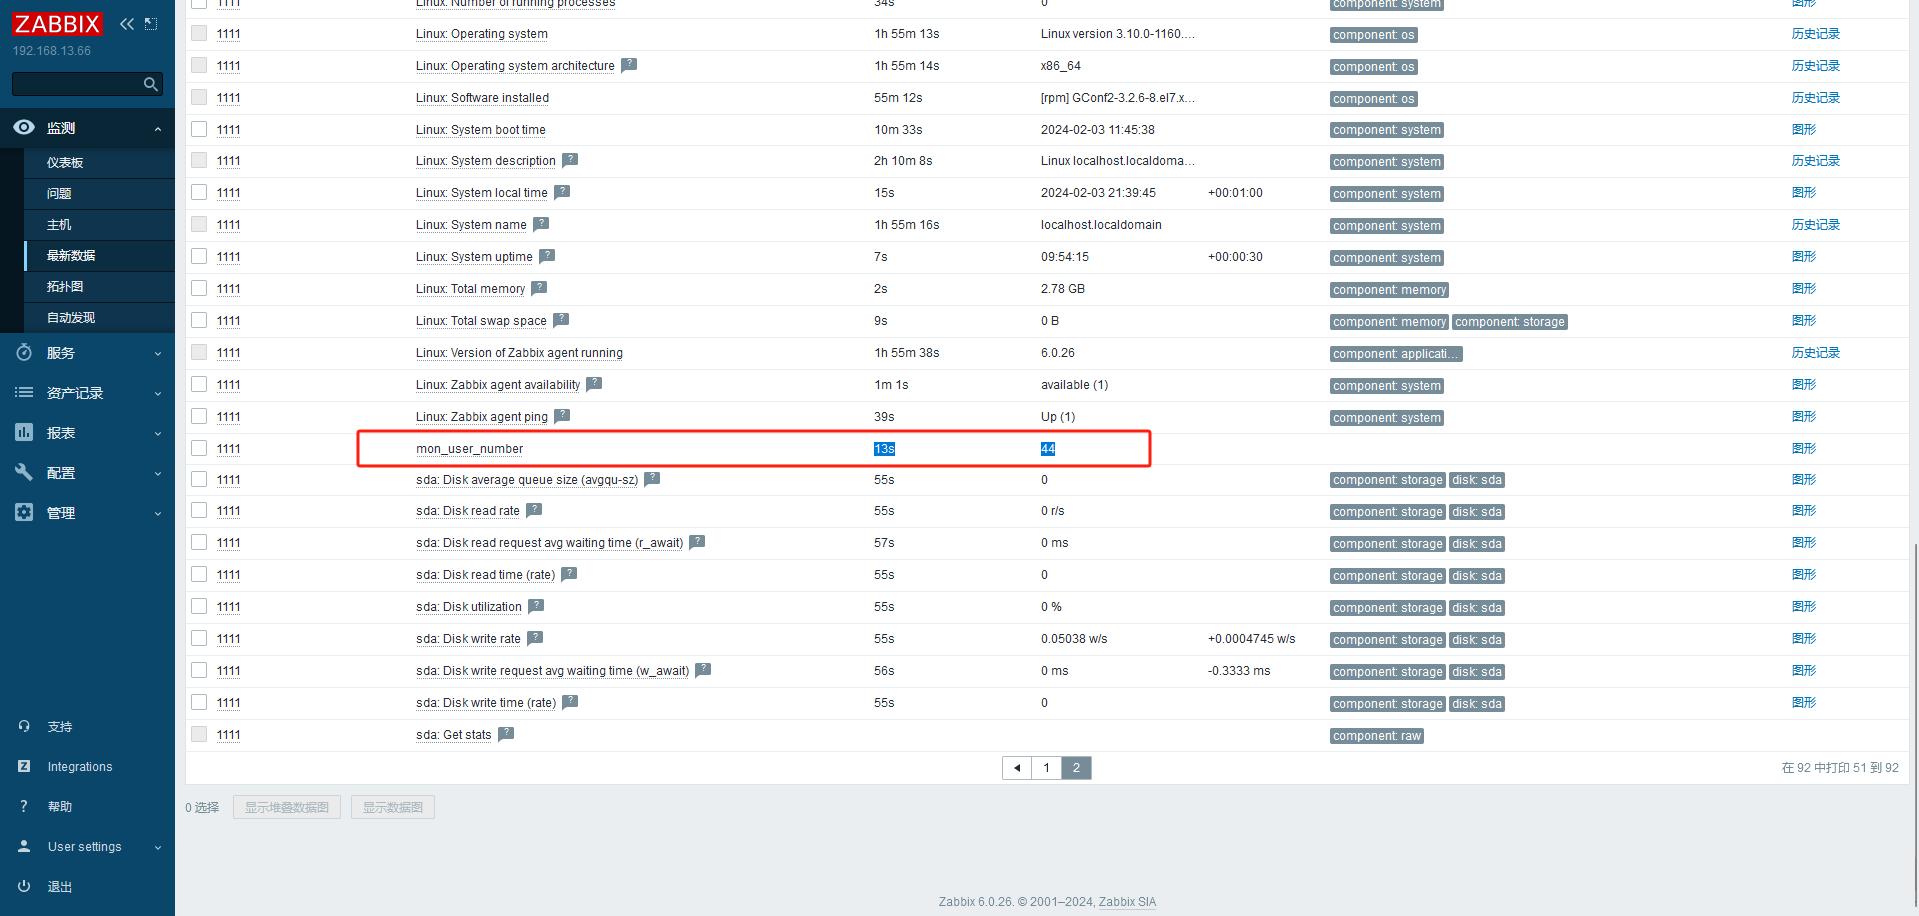
# 自定义监控项# 配置客户端启用自定义监控,编写监控脚本
1
2
3
4
5
6
vim /etc/zabbix/zabbix_agent2.conf 317 UnsafeUserParameters=1 281 Include=/etc/zabbix/zabbix_agent2.d/*.conf vim /etc/zabbix/zabbix_agent2.d/aaa.conf UserParameter=get_user_number,wc -l /etc/passwd | awk '{print $1}'
重启服务
systemctl restart zabbix-agent2.service
测试:
1
2
yum install zabbix-get -y zabbix_get -s 127.0.0.1 -k get_user_number
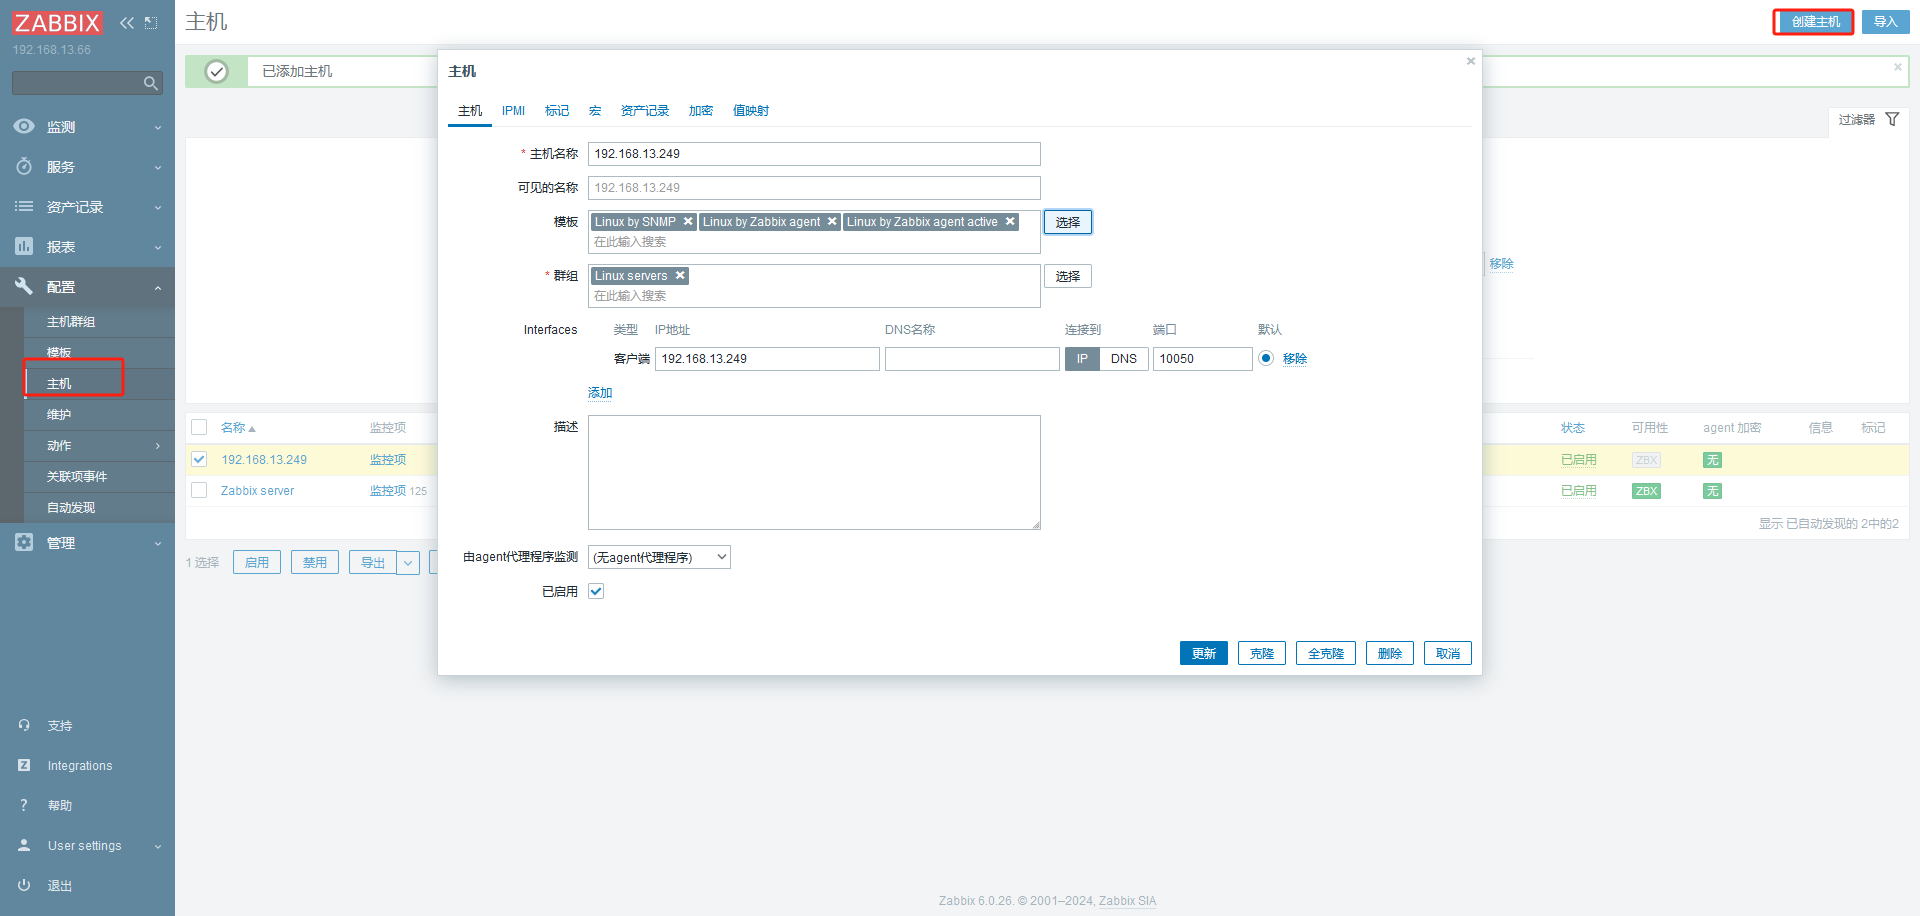
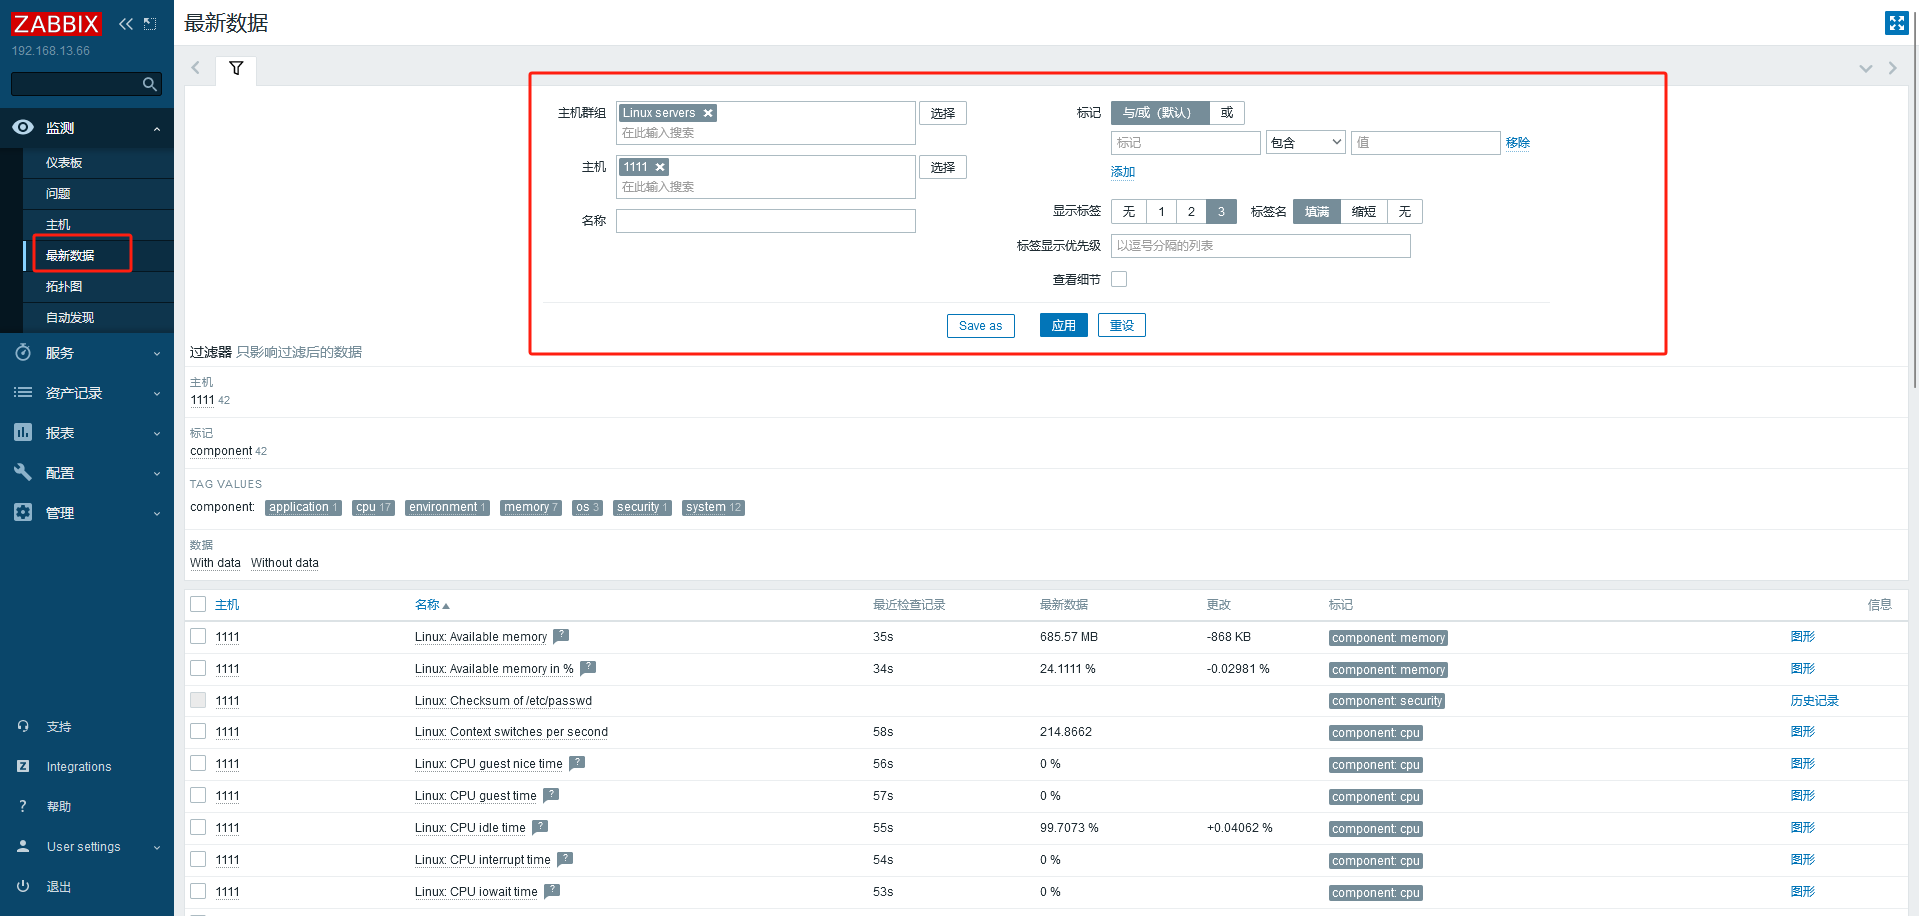
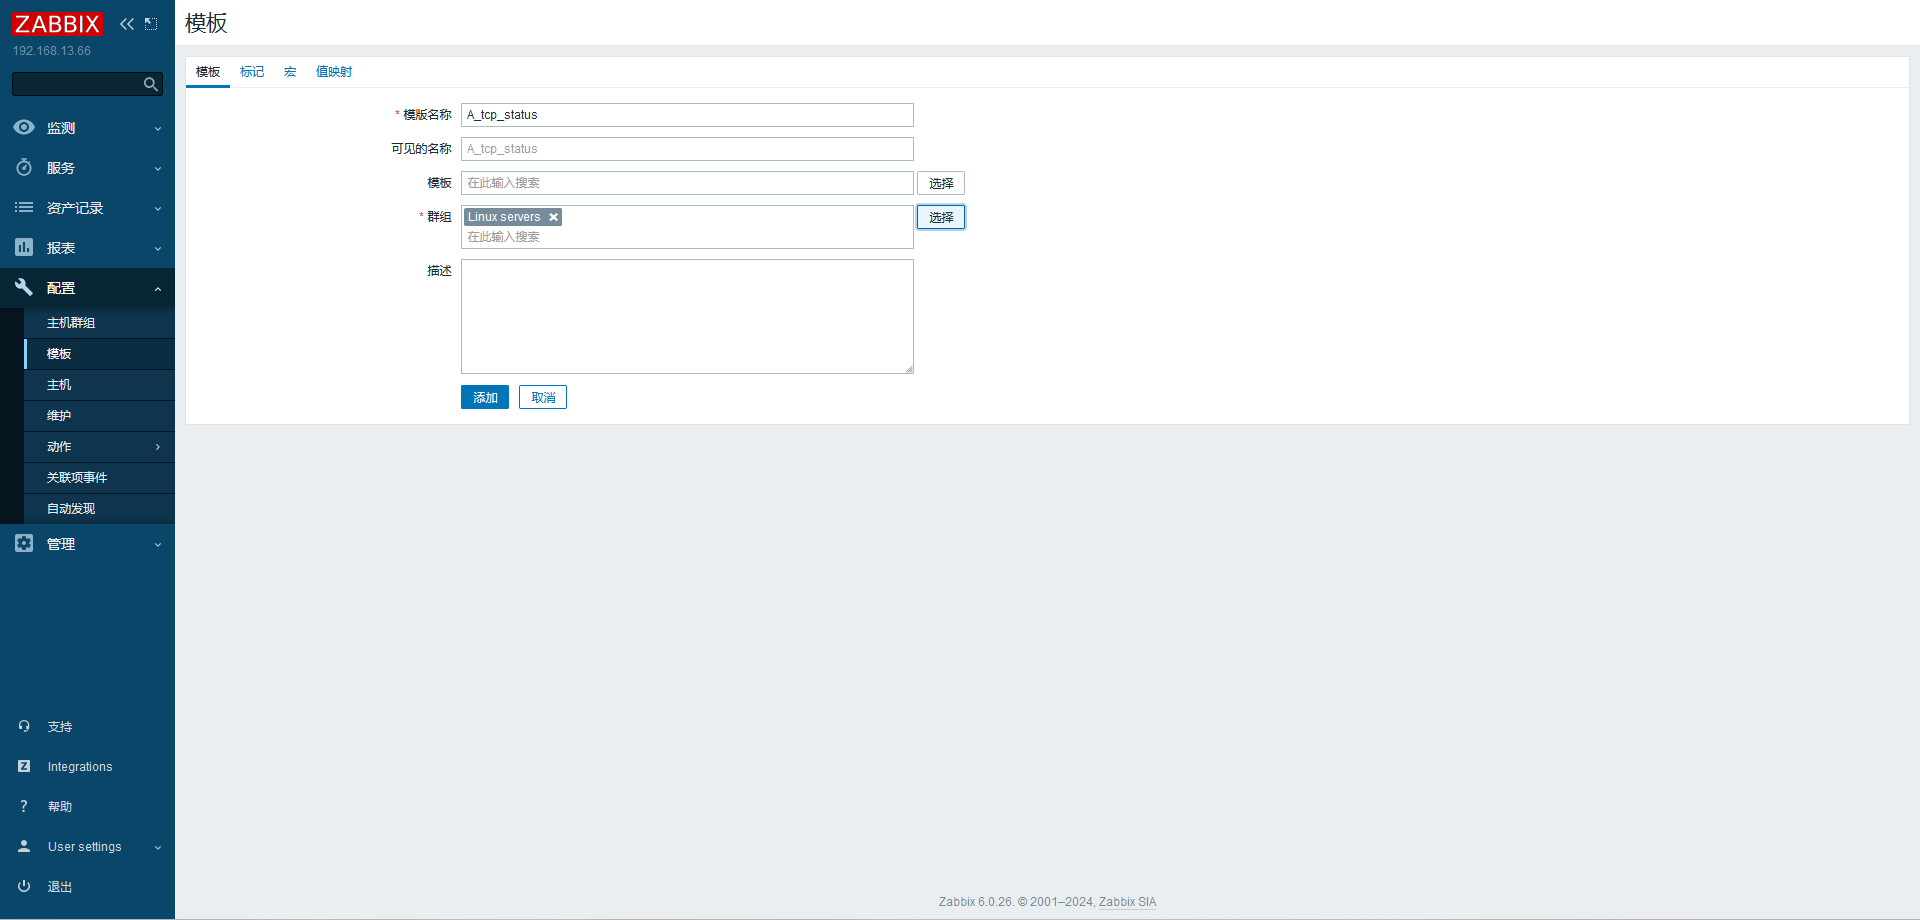
# 配置服务器创建监控模板
创建应用集
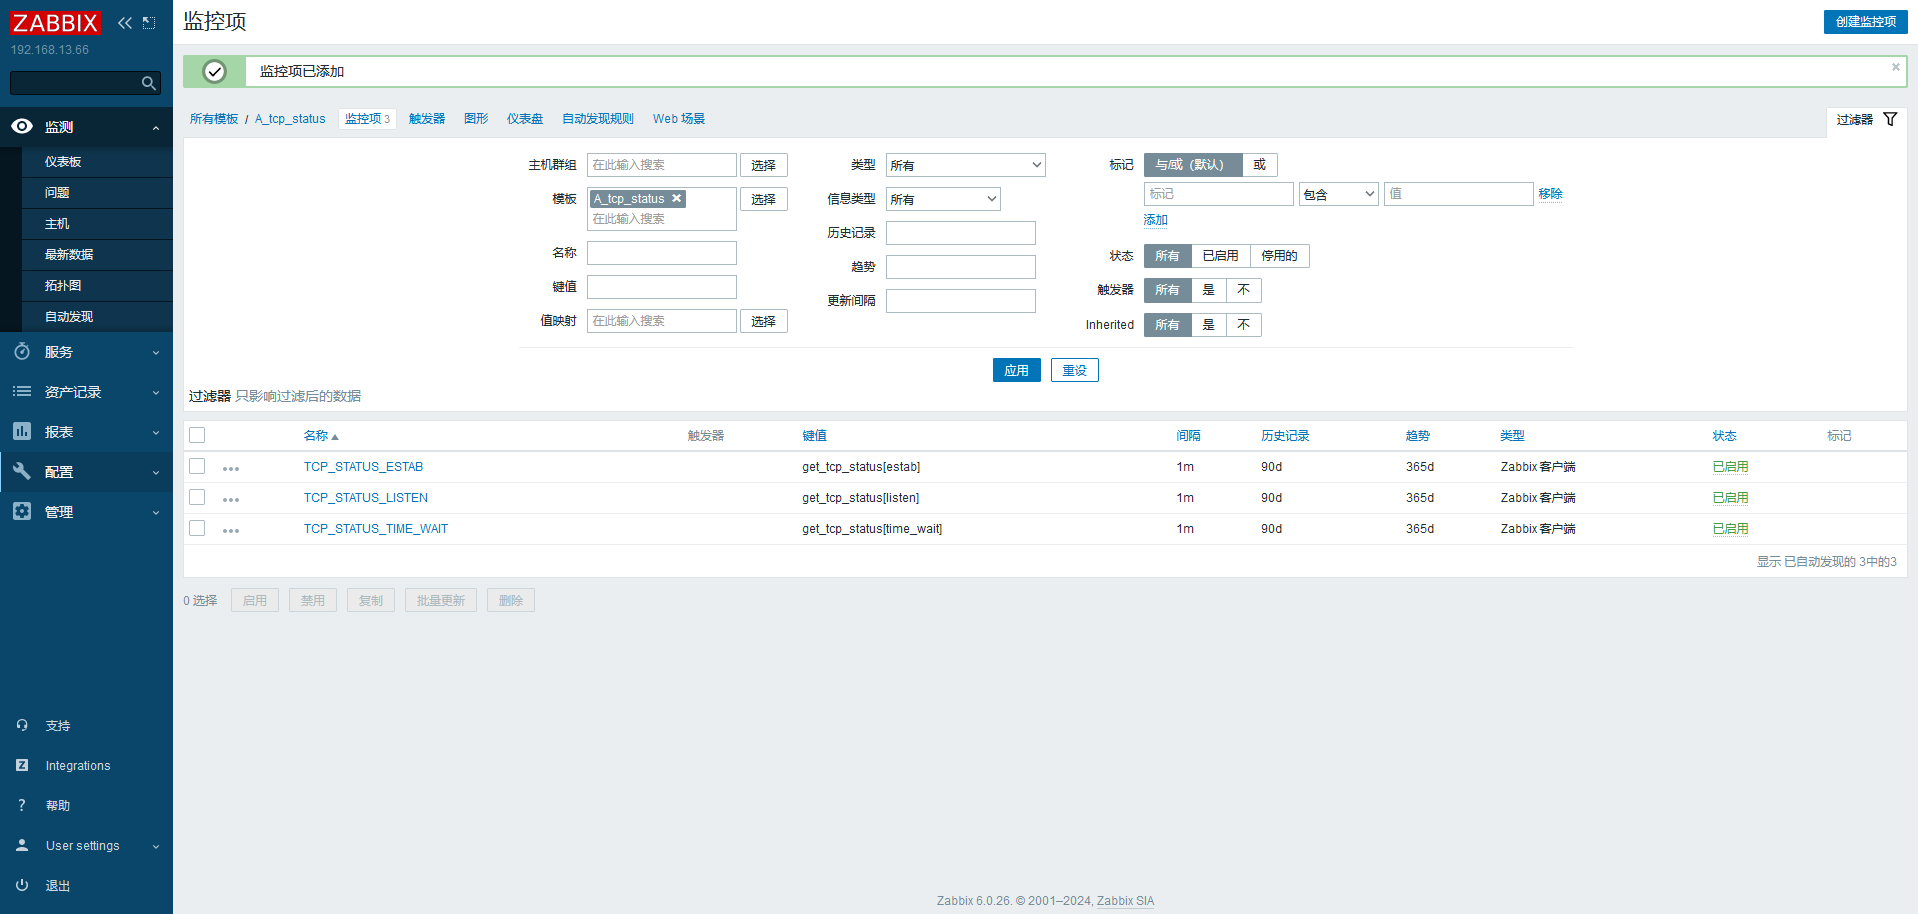
监控项 对应监控命令,可以先测试,得到返回结果
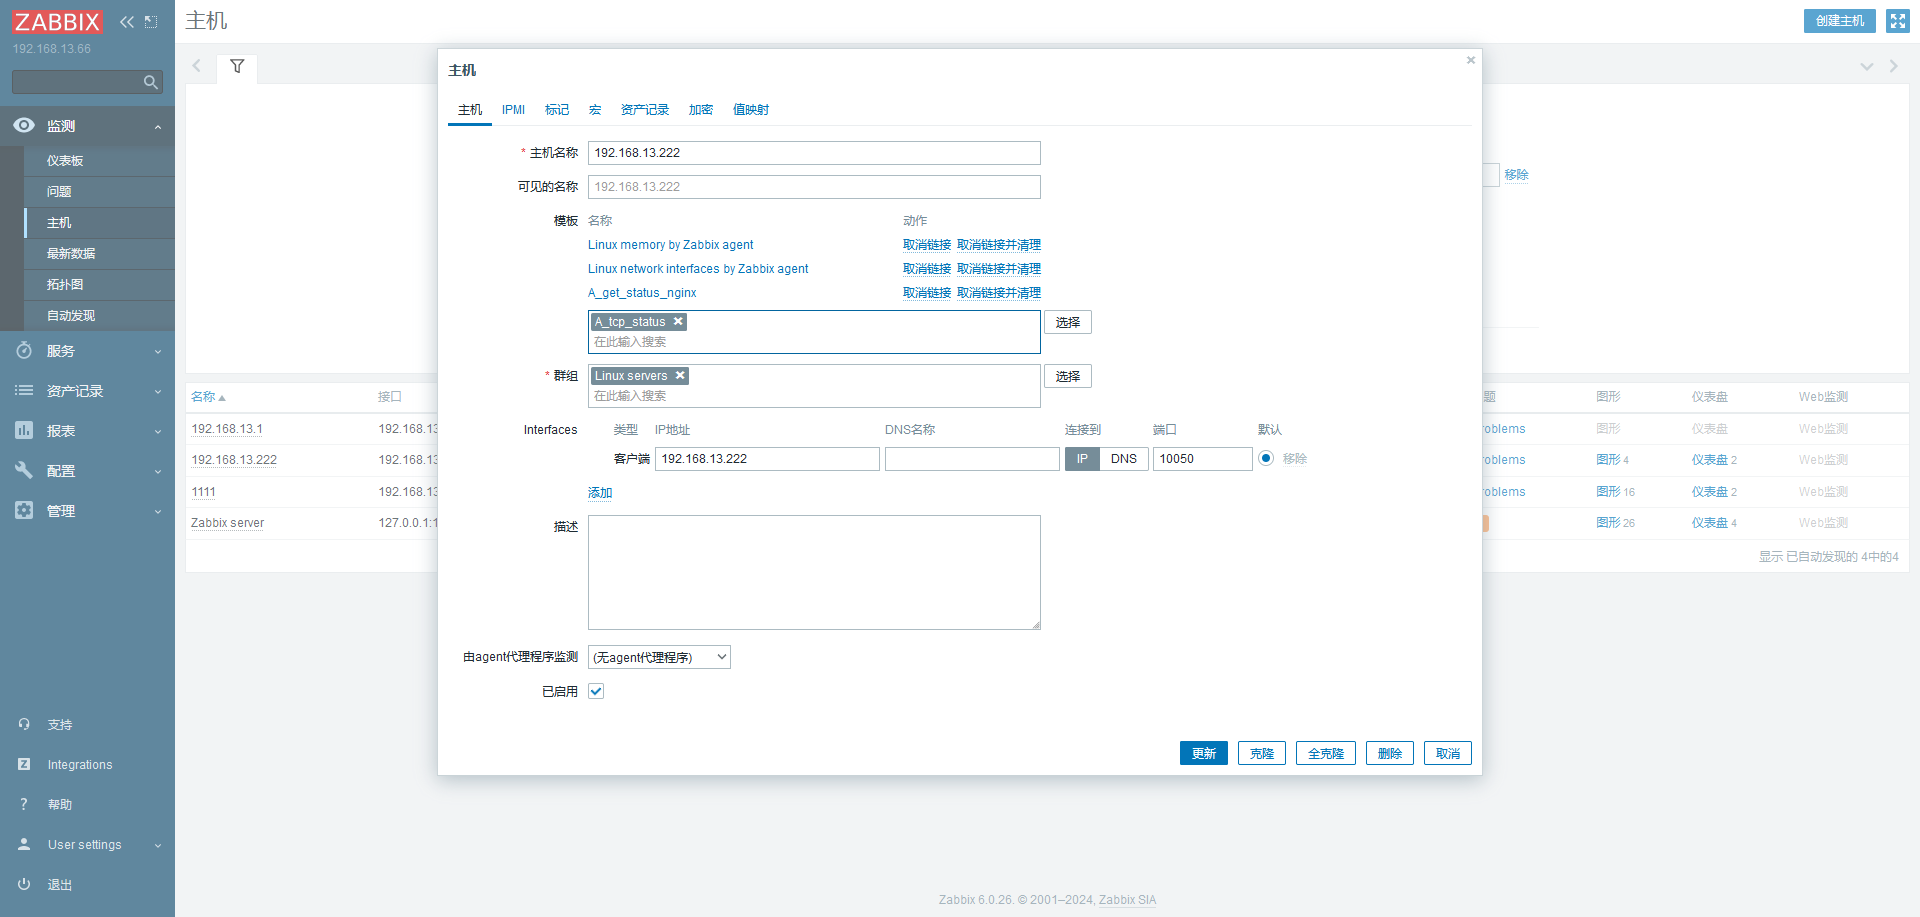
调用创建的监控模板监控主机
# 报警机制自定义的监控项默认不会自动报
警首页也不会提示错误
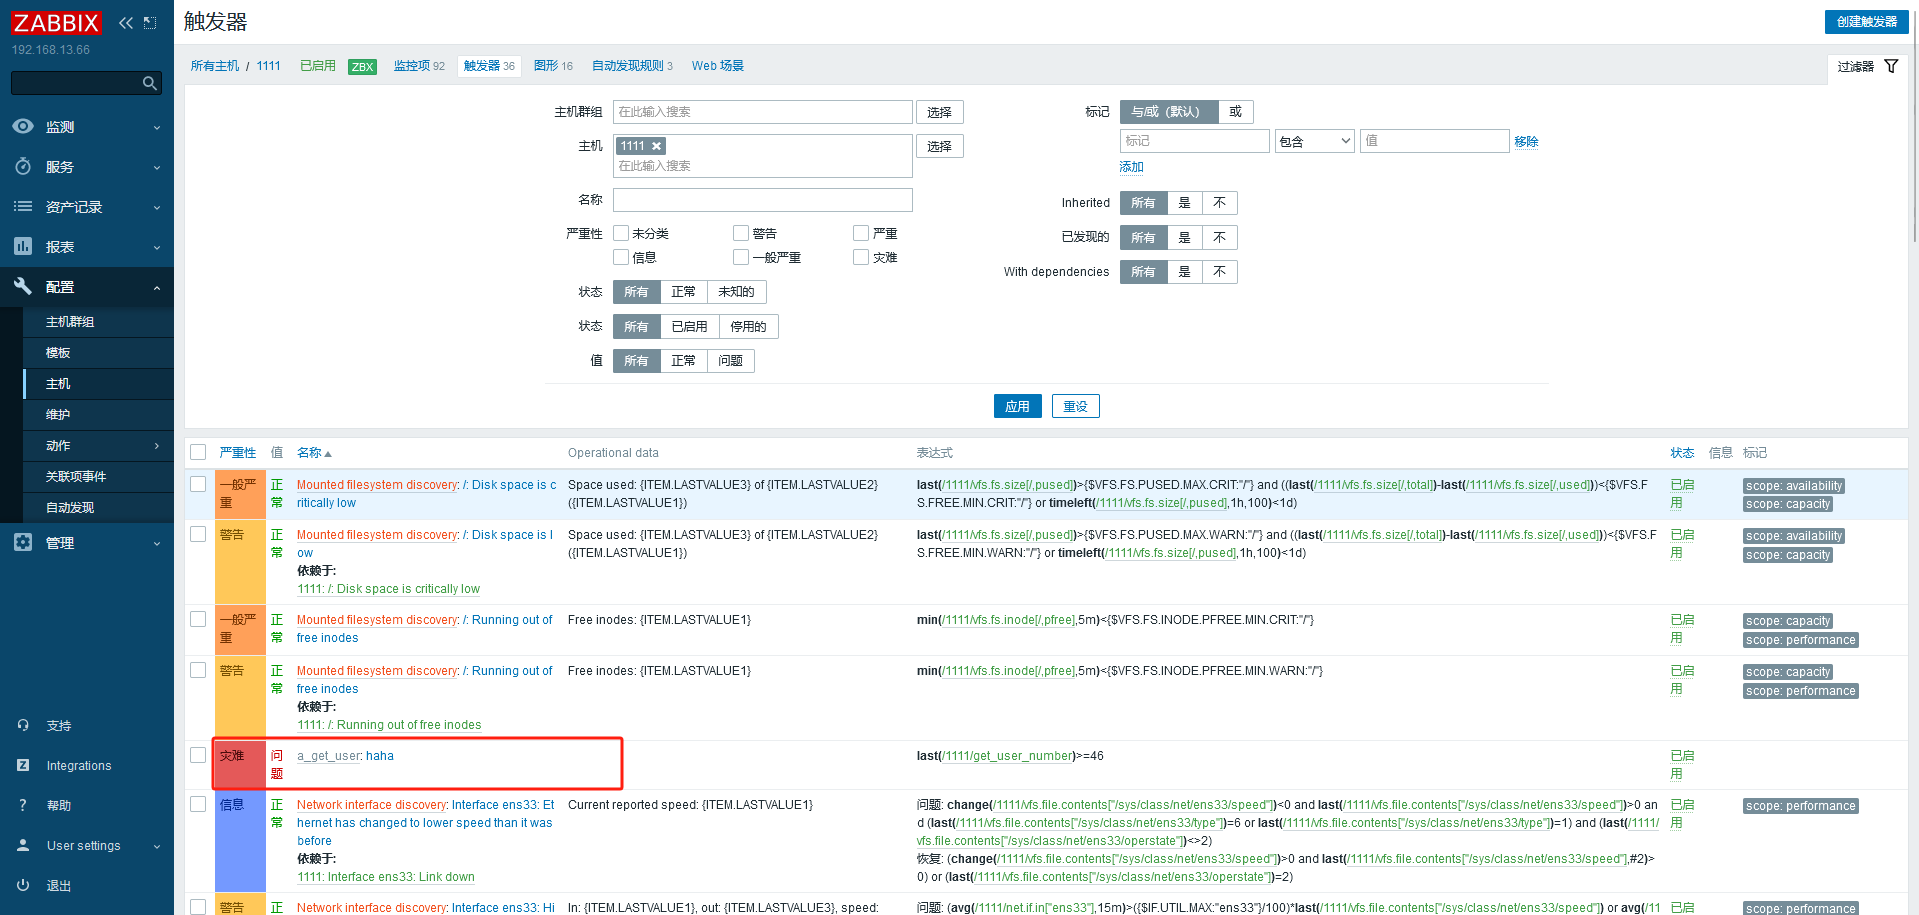
需要配置触发器与报警动作才可以自动报警
触发器 (trigger, 表达式)
如内存不足 300M,用户超过 30 个等
当触发条件发生后,会导致一个触发事件触发事件
会执行某个动作
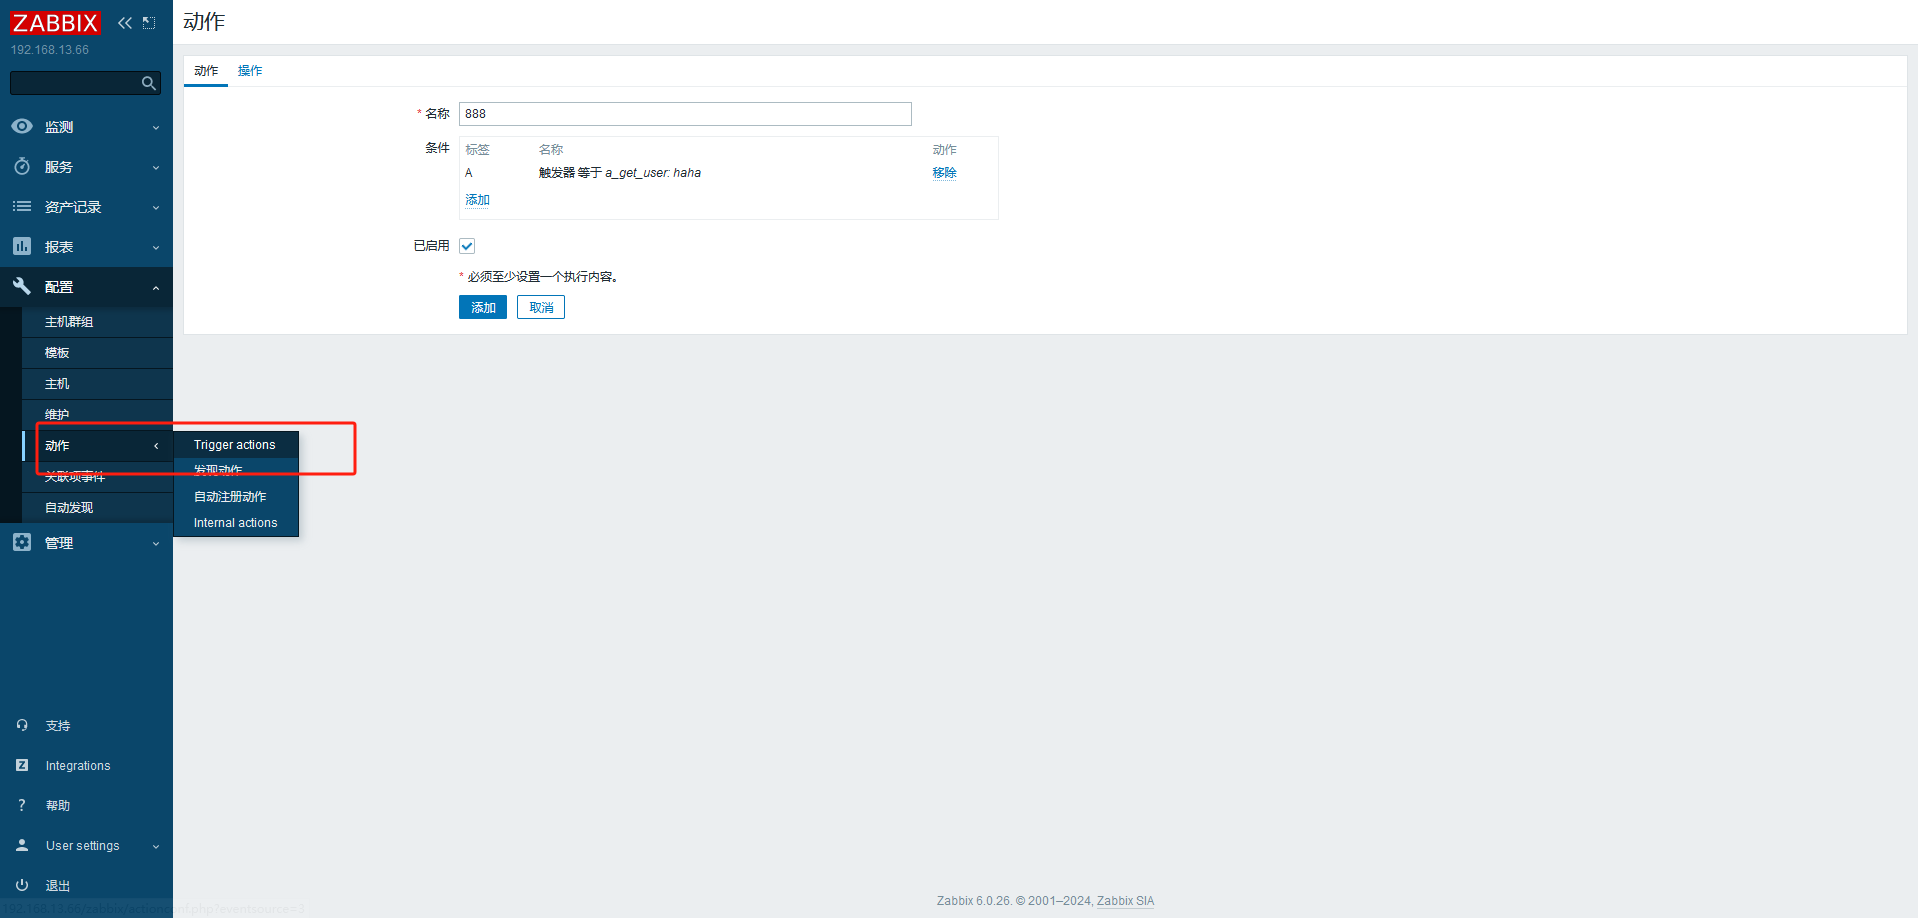
动作 (action)
触发器的条件被触发后的行为
可以是发送邮件、也可以是重启某个服务等
创建触发器
1
2
{<server>,<key>.<function>(<parameter>)}<operator><constant> {主机:key.函数(参数)}<表达式>常数
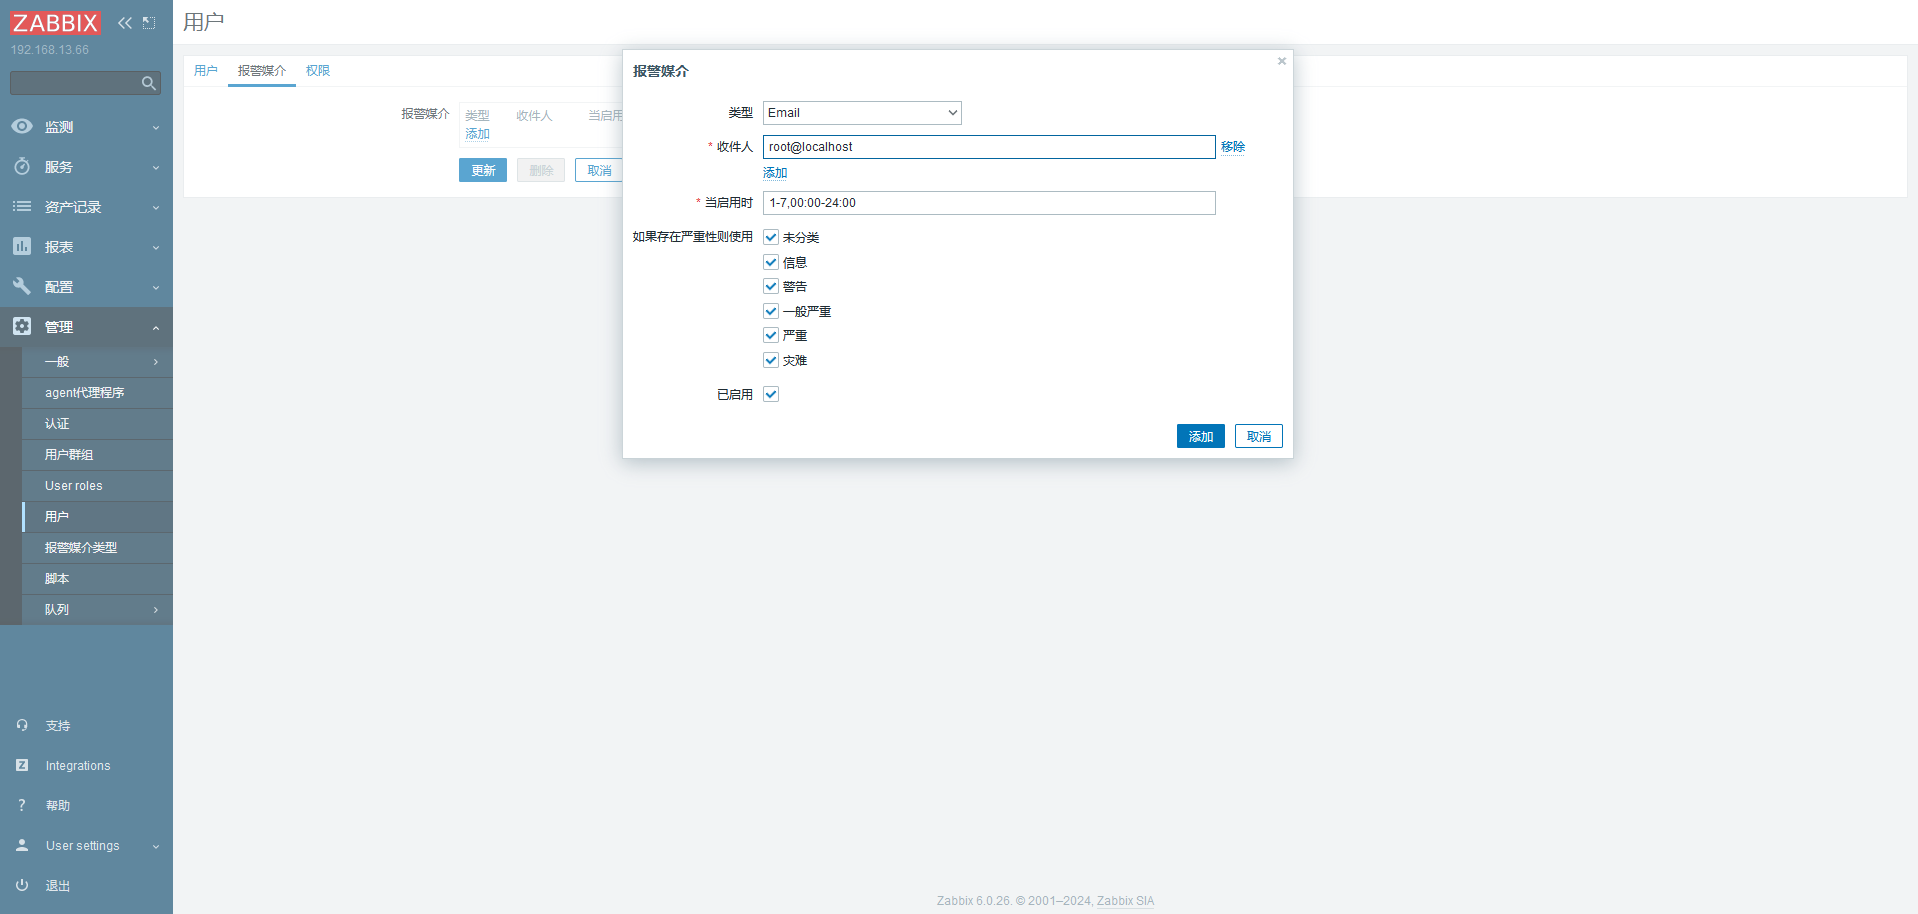
创建报警类型
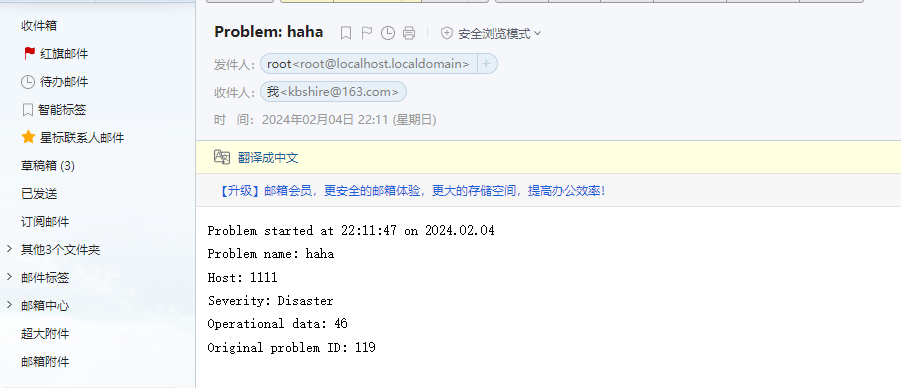
1
2
3
4
5
6
7
// 搭建邮箱服务器 yum install postfix systemctl enable postfix --now yum install mailx -y mail -s "xxx" root < /etc/passwd
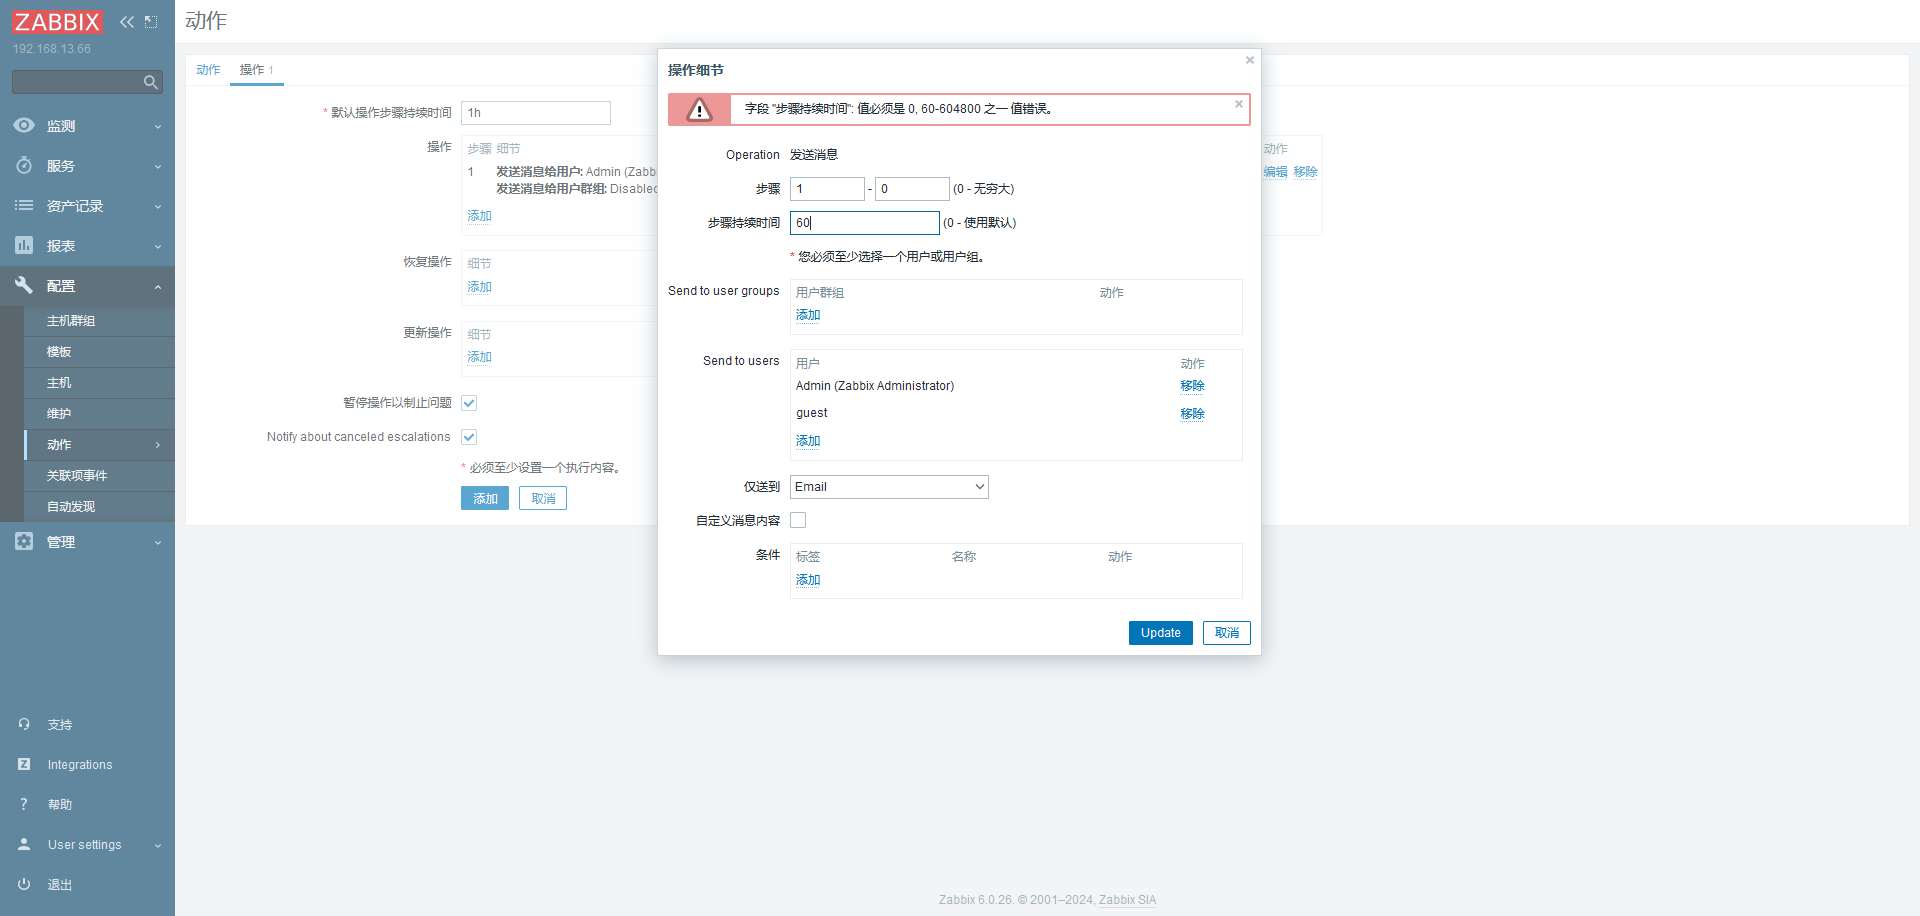
创建动作
验证:
按照配置,会每 60s 发送一封。除非触发器条件不满足
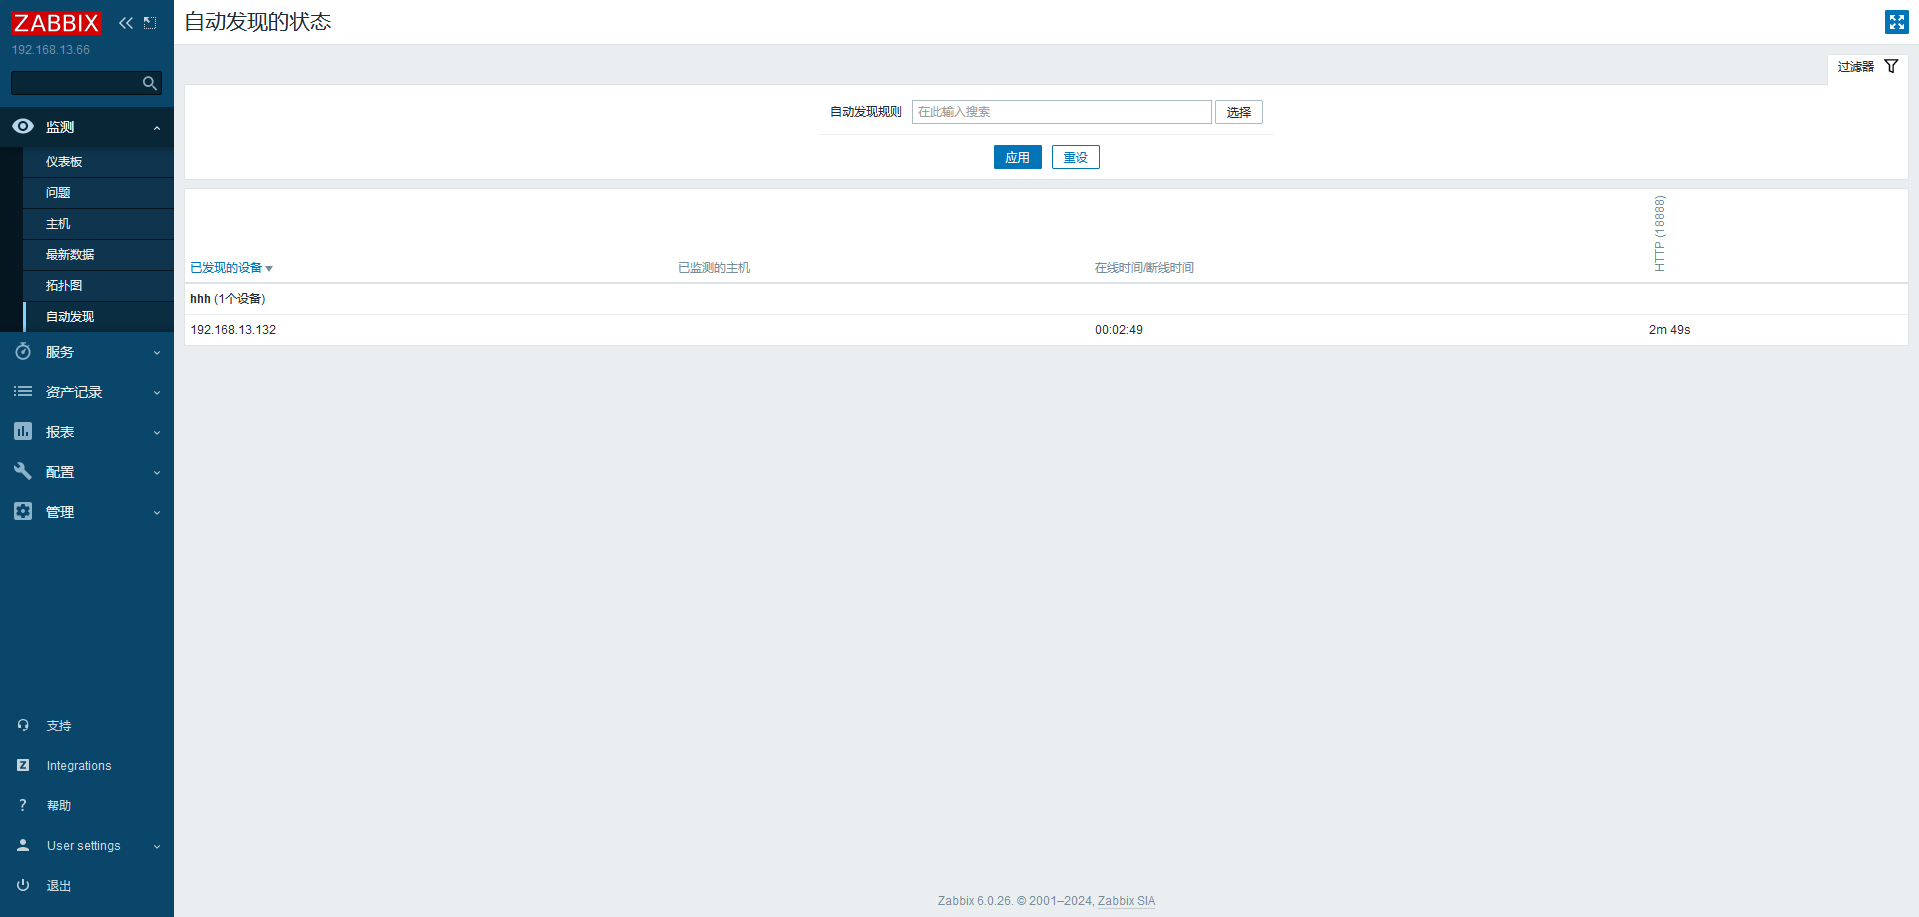
# 自动发现自动发现 (Discovery)
当 Zabbix 需要监控的设备越来越多,手动添加监控设备越来越有挑战,此时,可以考虑使用自动发现功能
自动发现可以实现
发现主机、添加主机,添加主机到组、连接模板等
自动发现 (Discovery) 流程
创建自动发现规则
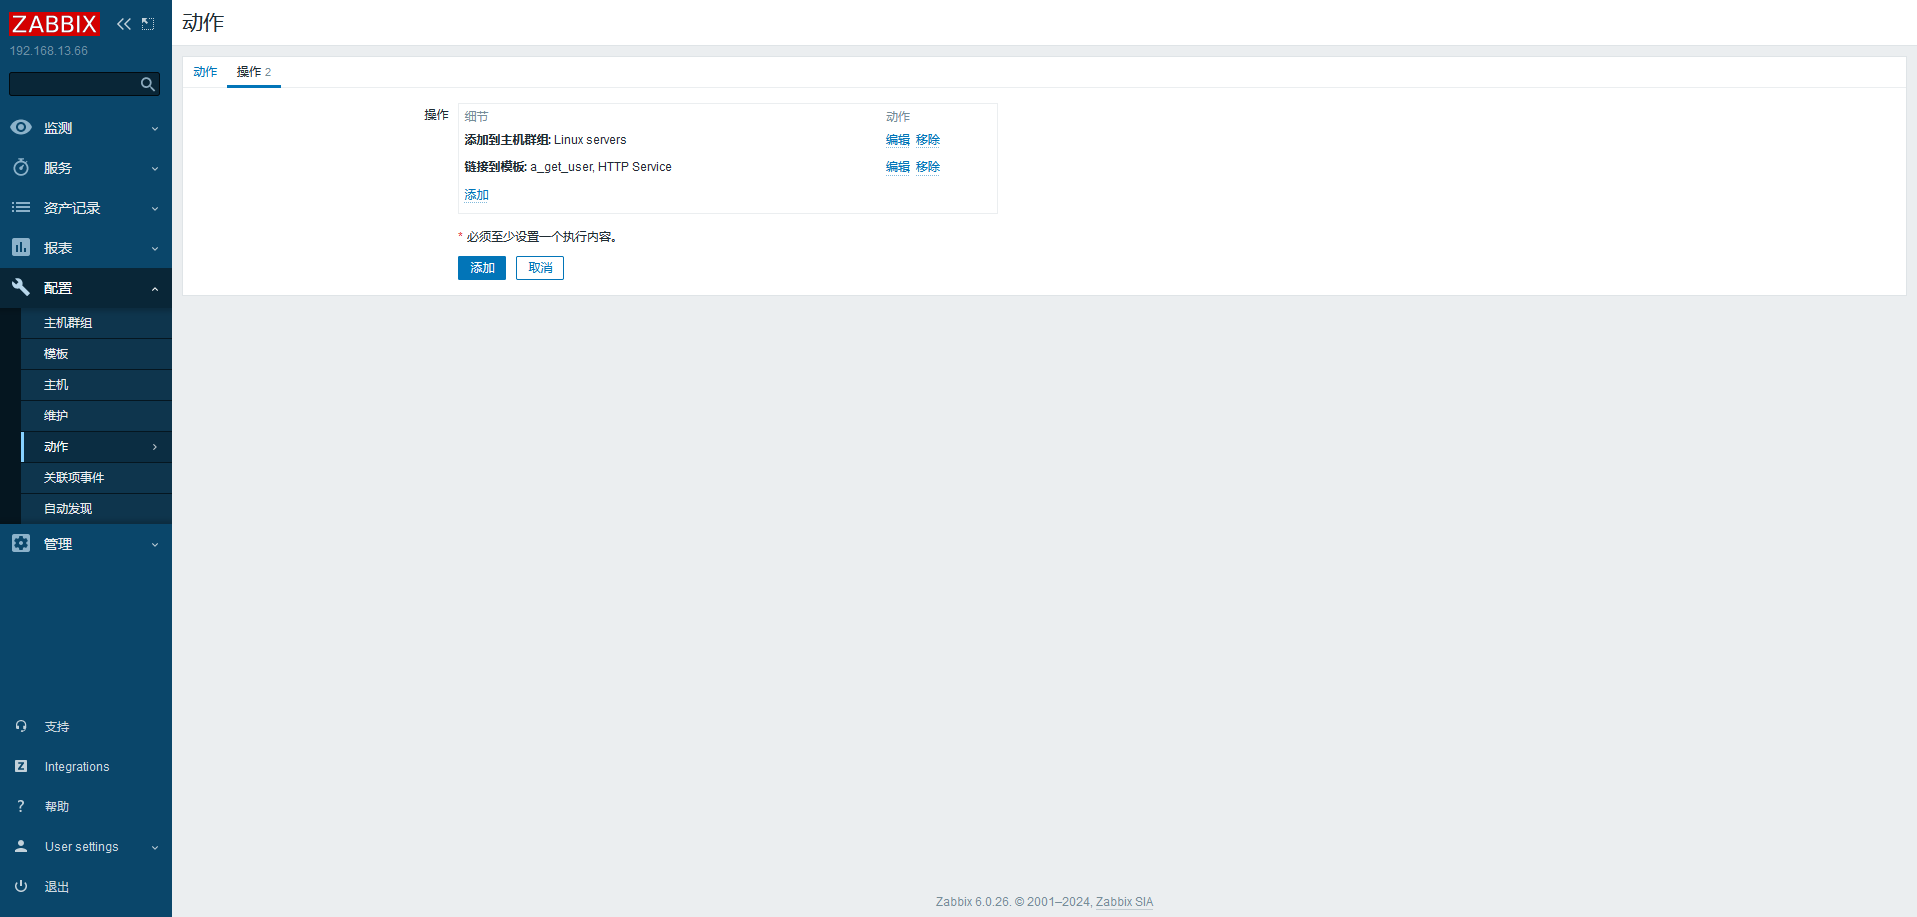
创建 Action 动作 (发现主机后自动执行什么动作)
通过动作,执行添加主机,链接模板到主机等操作
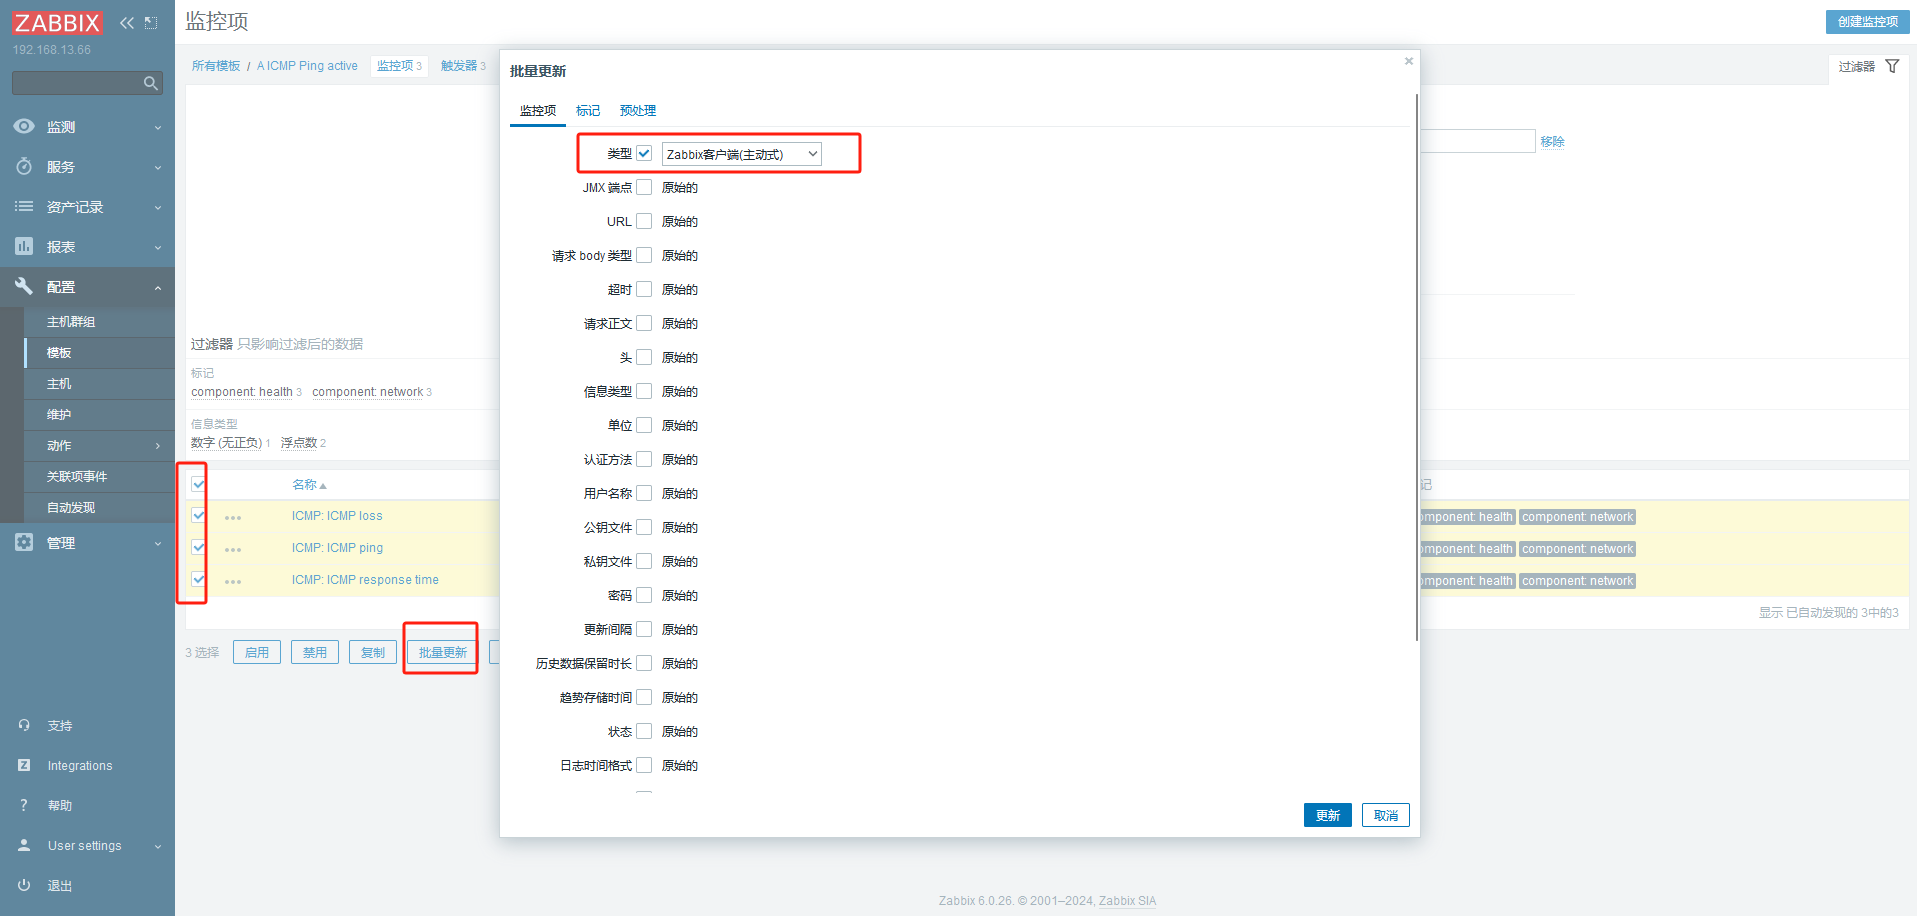
# 主动监控主动和被动都是对被监控端主机而言的
默认 zabbix 采用的是被动监控
被动监控:Server 向 Agent 发起连接,发送监控 keyAgent 接受请求,响应监控数据
主动监控:Agent 向 Server 发起连接,Agent 请求需要检测的监控项目列表,Server 响应 Agent 发送一个 items 列表 Agent 确认收到监控列表,TCP 连接完成,会话关闭 Agent 开始周期性地收集数据
区别
Server 不用每次需要数据都连接 Agent,Agent 会自己收集数据并处理数据,Server 仅需要保存数据即可
当监控主机达到一定量级后,Zabbix 服务器会越来越慢释放服务器的压力
此时,可以考虑使用主动监控另外,Zabbix 也支持分布式监控,也是可以考虑的方案
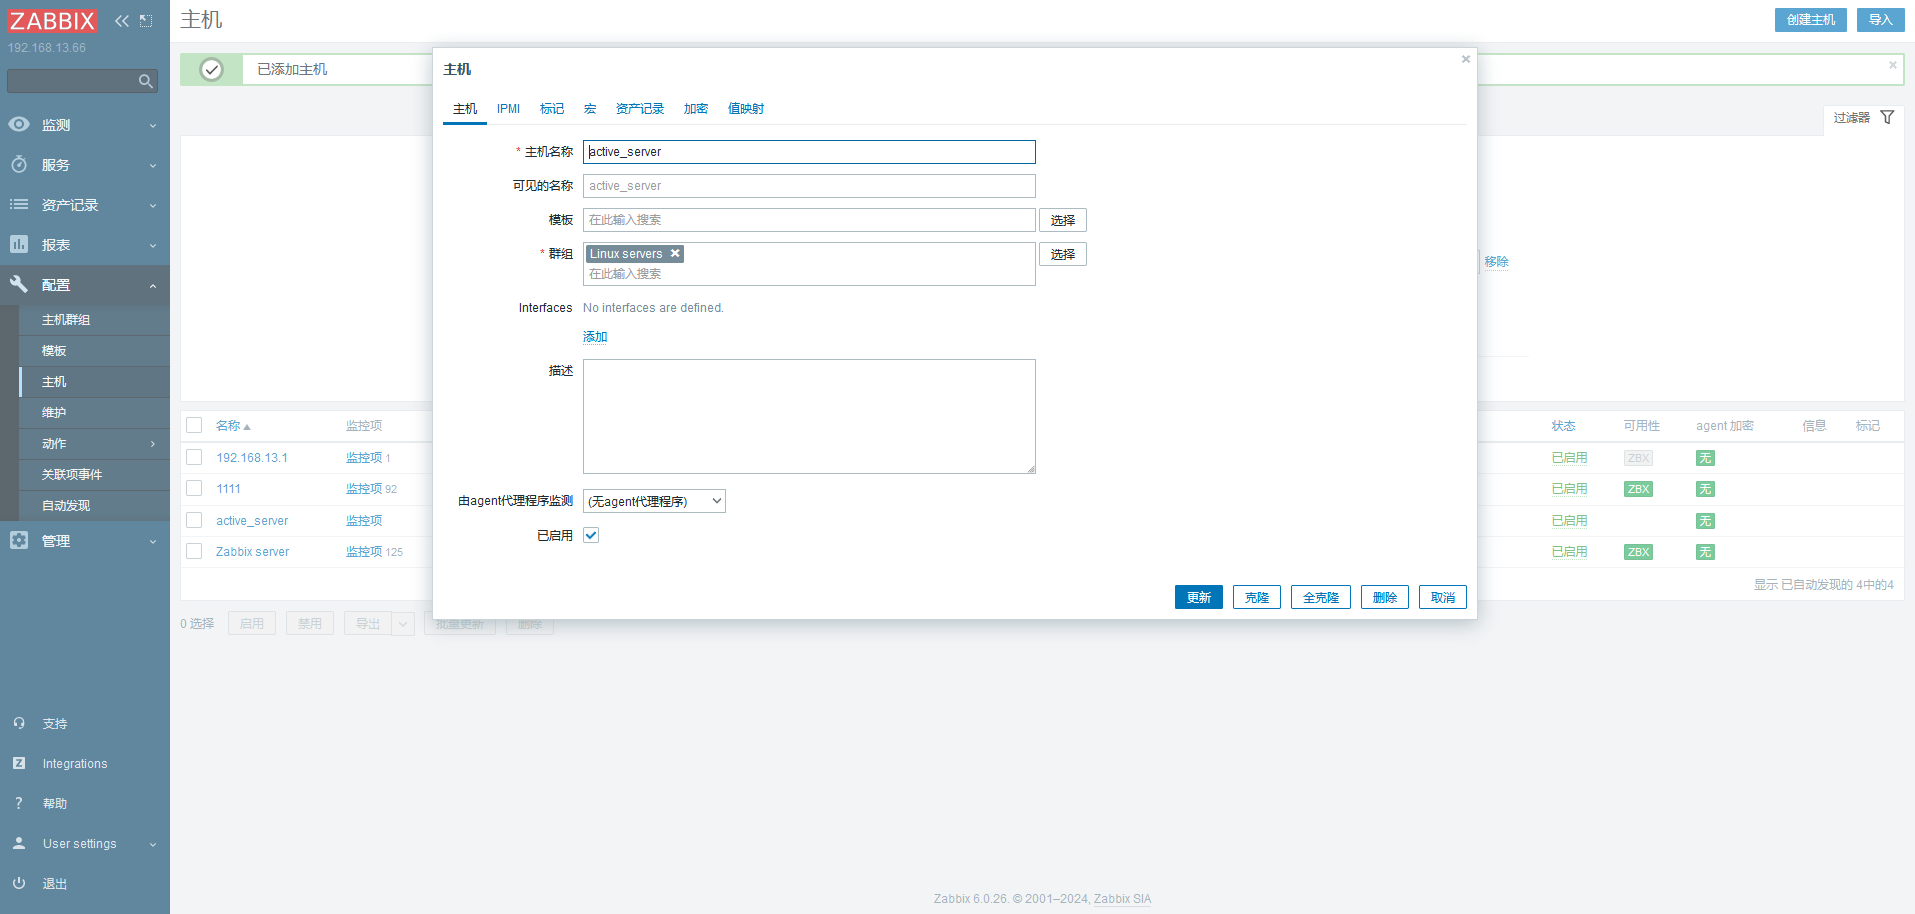
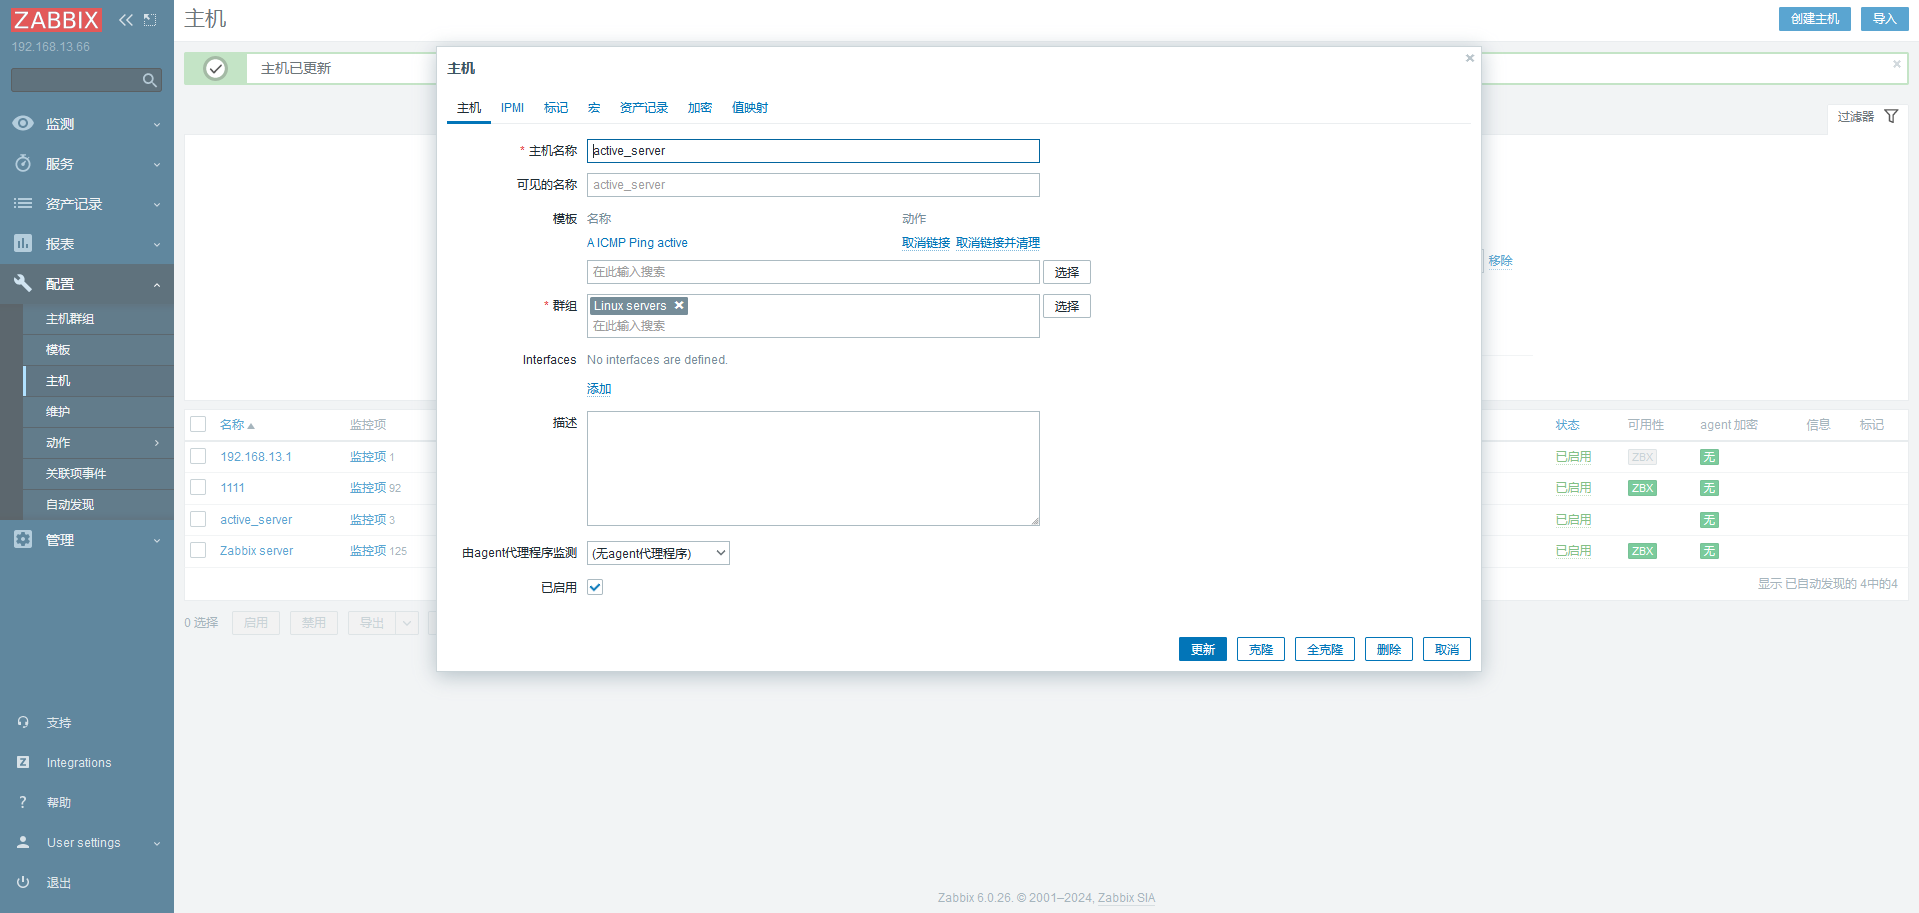
1
2
3
4
5
6
7
8
9
10
11
12
13
14
15
16
17
yum -y reinstall --downloadonly --downloaddir=./ zabbix-agent2* vim zabbix_agent2.conf #Server=127.0.0.1 ServerActive=192.168.13.66 Hostname=active_server RefreshActiveChecks=120 // 此时不监听端口 [root@localhost zabbix]# netstat -lntup Active Internet connections (only servers) Proto Recv-Q Send-Q Local Address Foreign Address State PID/Program name tcp 0 0 0.0.0.0:22 0.0.0.0:* LISTEN 821/sshd tcp 0 0 127.0.0.1:25 0.0.0.0:* LISTEN 1051/master tcp6 0 0 :::22 :::* LISTEN 821/sshd tcp6 0 0 ::1:25 :::* LISTEN 1051/master
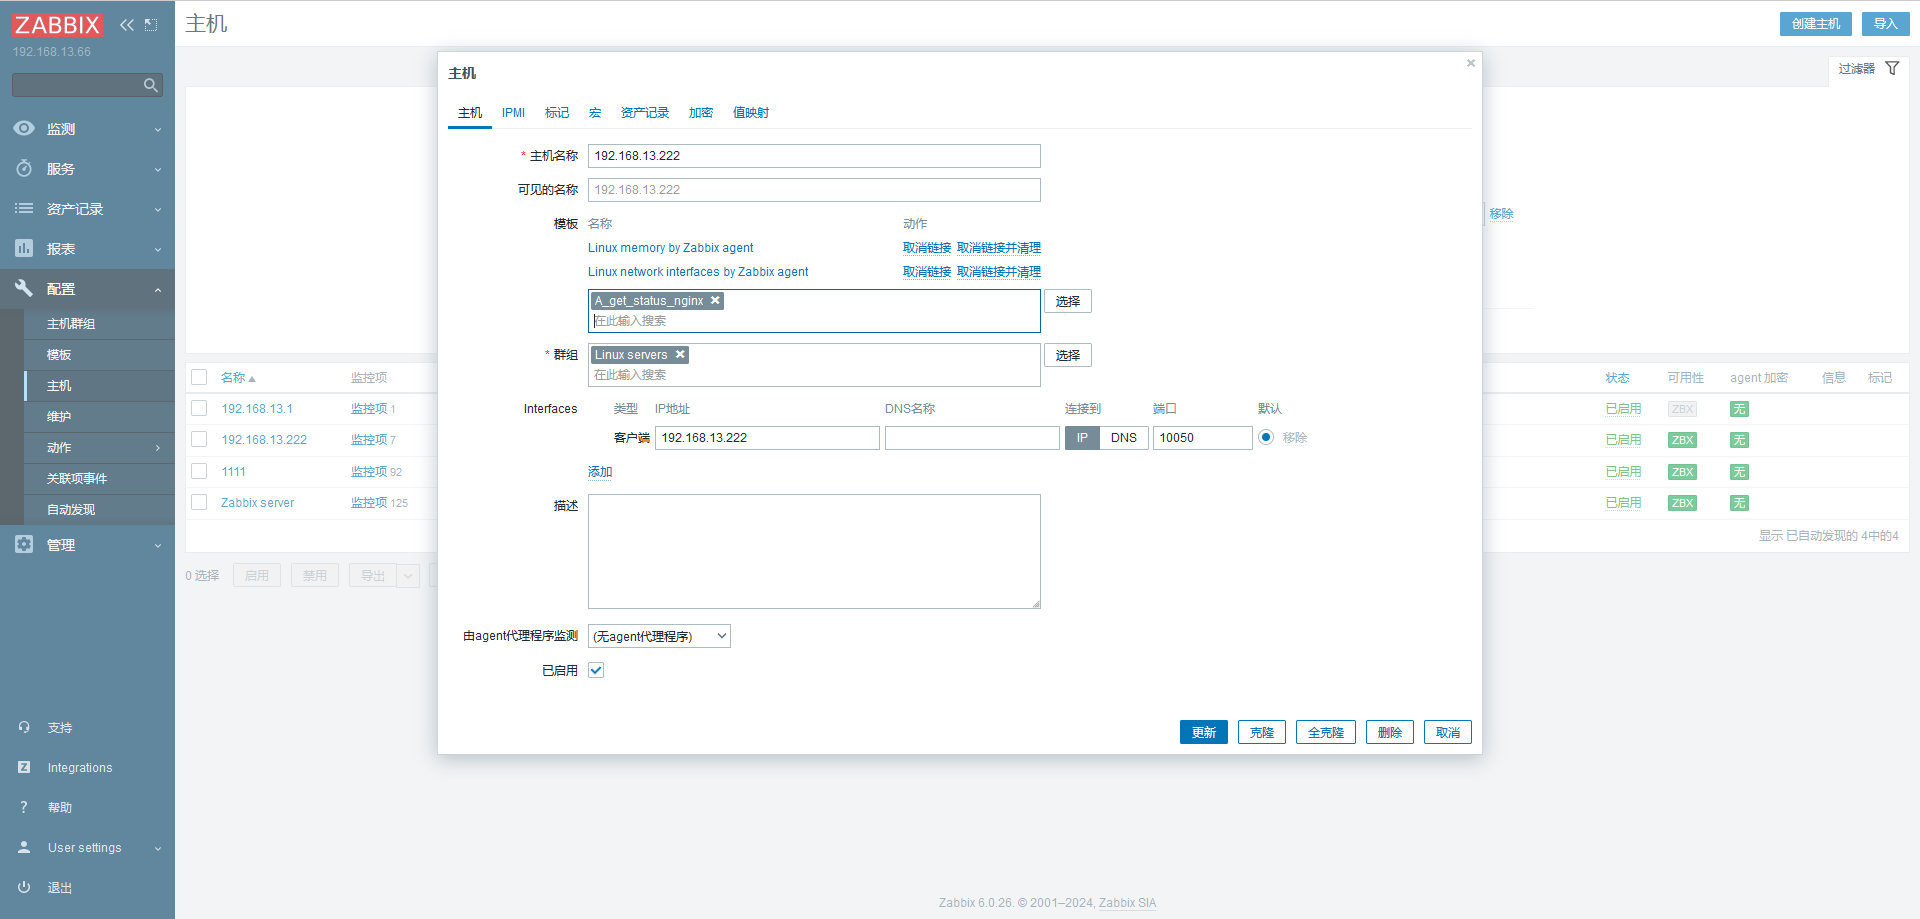
添加主机,名字和上面配置文件的一样
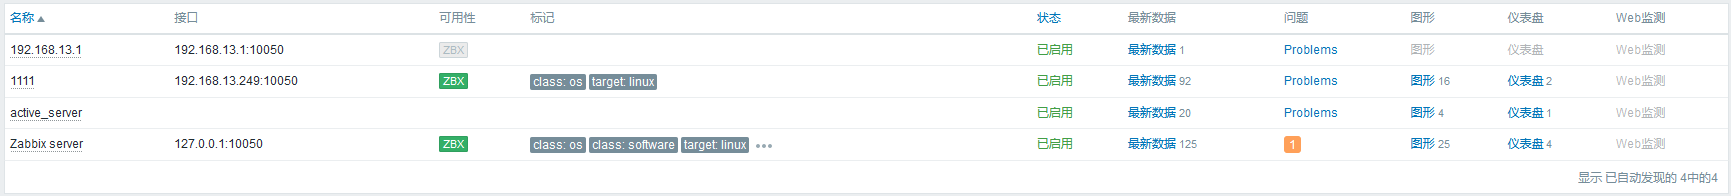
主动模式下不显示绿色的 zbx
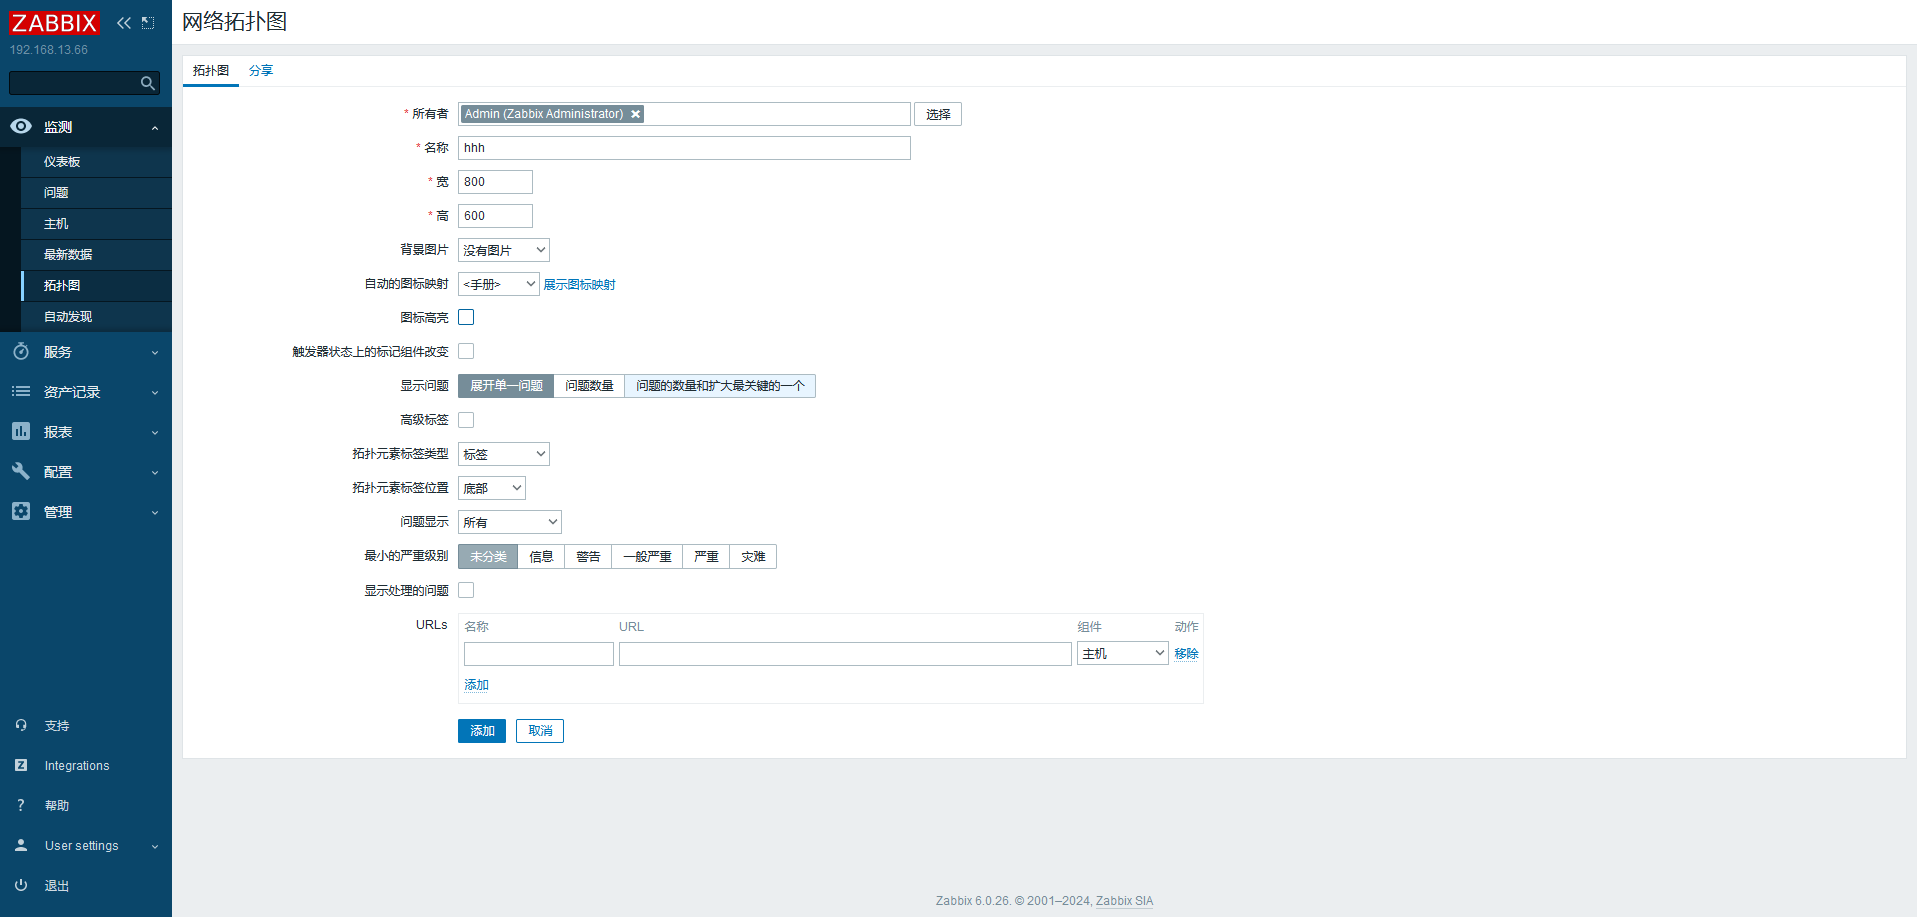
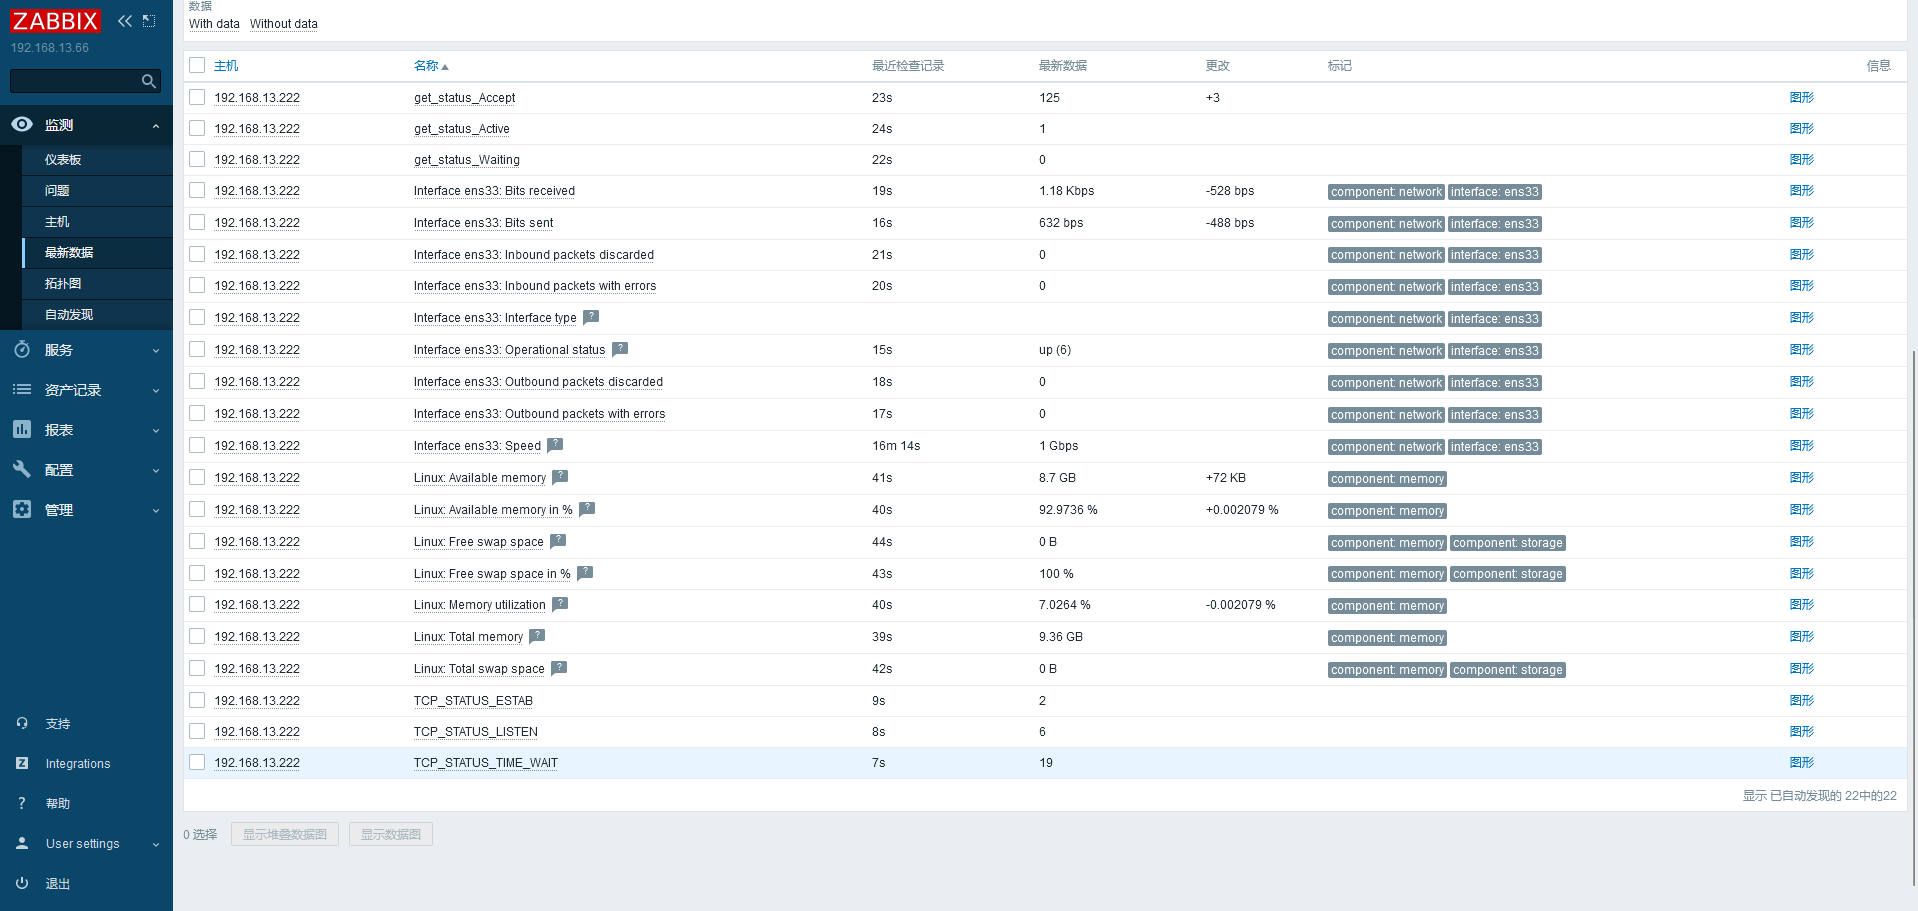
# 拓扑图
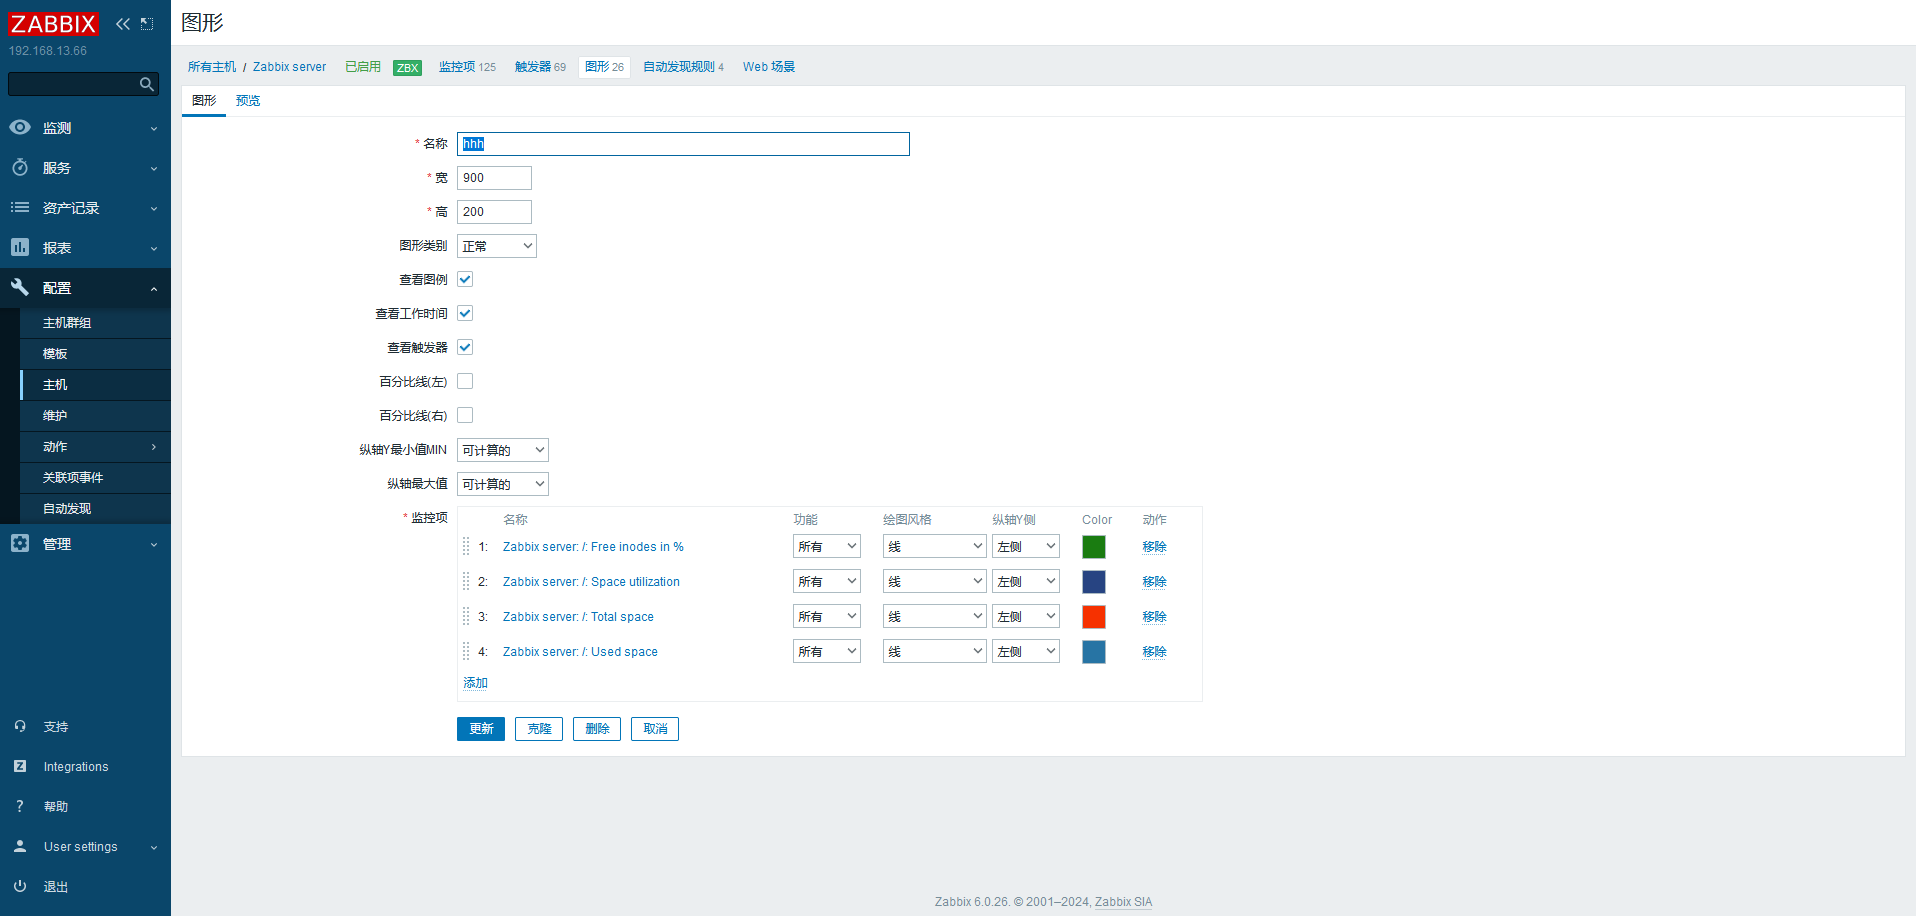
# 聚合图形在一个页面显示多个数据图表,方便了解多组数据
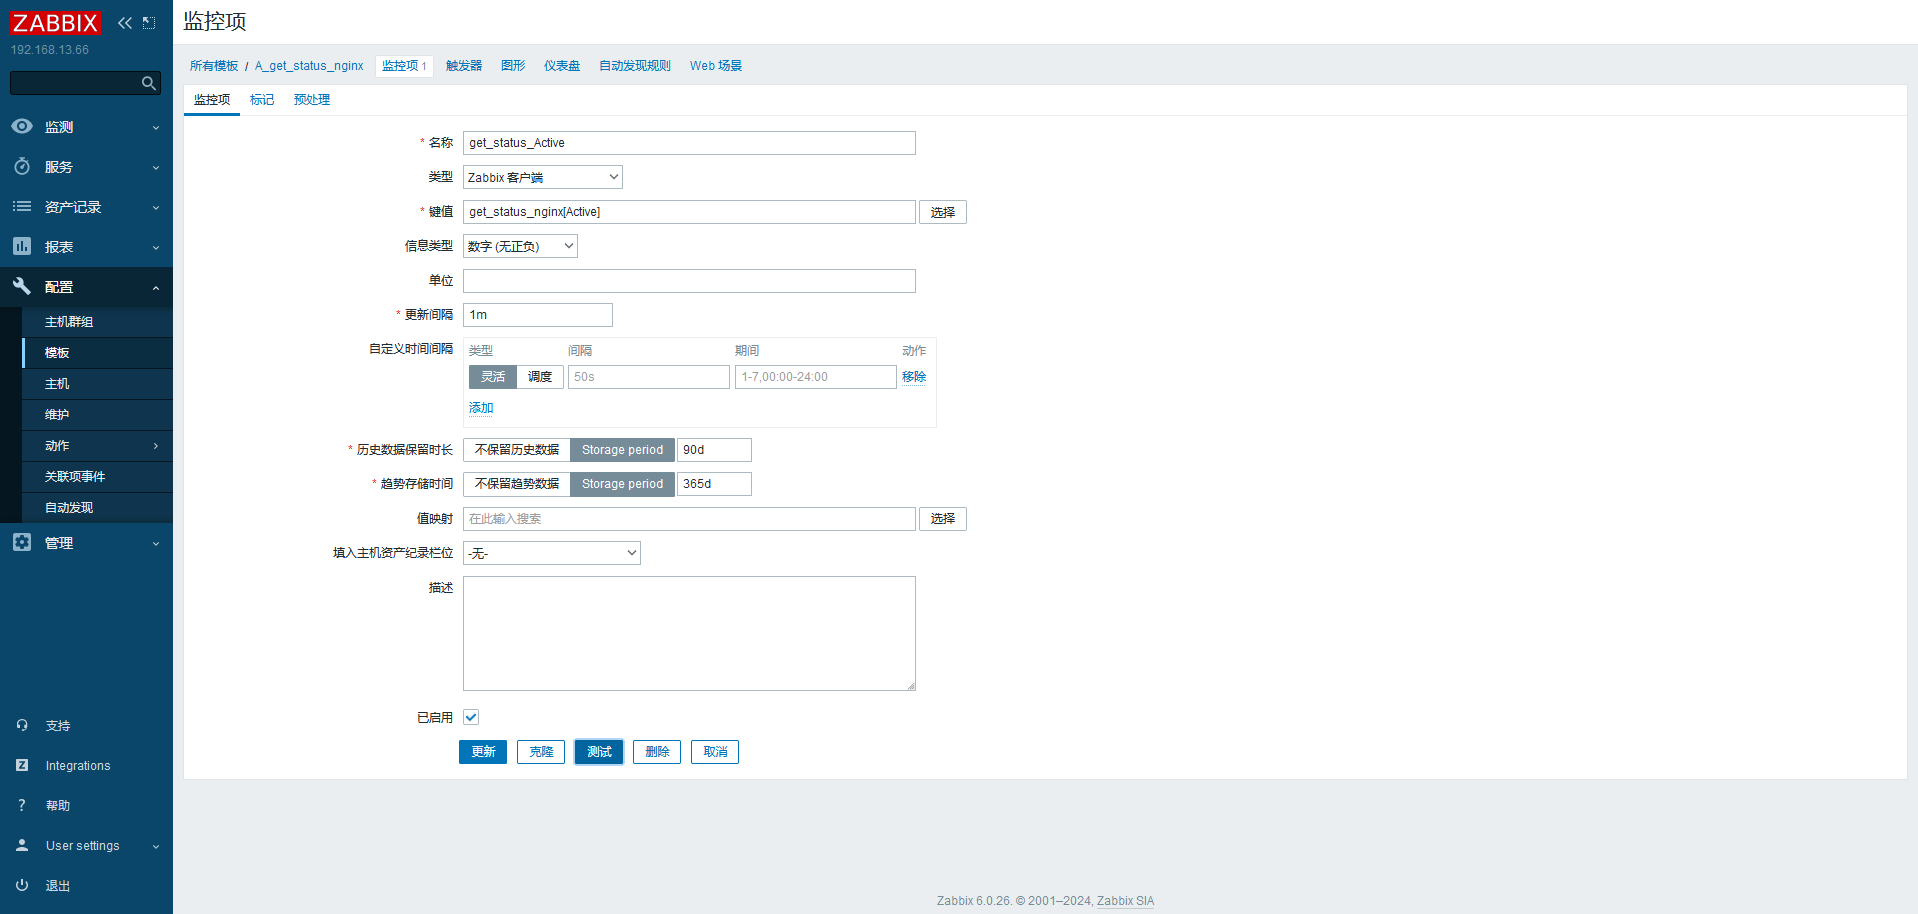
# 监控 nginx1 2 3 4 5 6 7 ./configure --prefix=/etc/nginx --sbin-path=/usr/sbin/nginx --modules-path=/usr/lib/nginx/modules --conf-path=/etc/nginx/nginx.conf --error-log-path=/var/log/nginx/error.log --http-log-path=/var/log/nginx/access.log --pid-path=/var/run/nginx.pid --lock-path=/var/run/nginx.lock --http-client-body-temp-path=/var/cache/nginx/client_temp --http-proxy-temp-path=/var/cache/nginx/proxy make && make install location /status { stub_status on; }
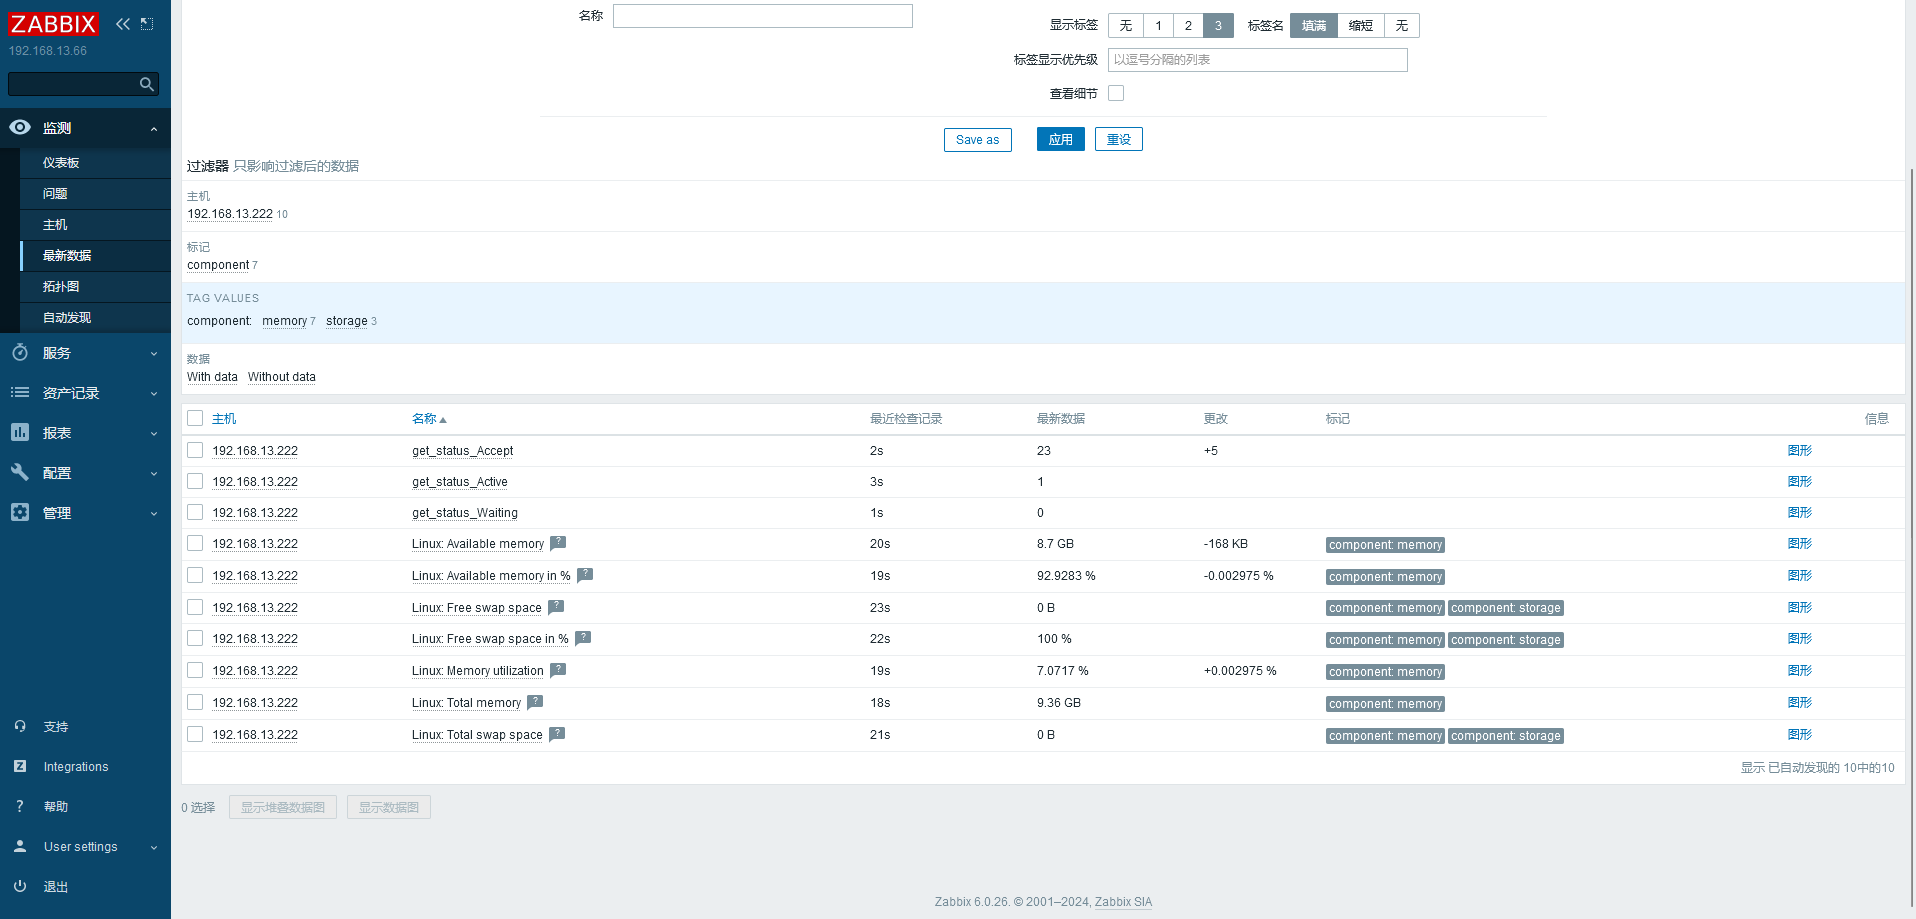
历史累计链接数量 处理链接数量 处理请求个数
处理读请求数量 处理写请求数量 等待处理请求数量
1 2 3 4 5 6 7 8 9 10 11 12 13 14 15 16 17 18 19 20 21 22 23 24 25 26 27 28 29 30 31 32 33 vim /home/status_nginx.sh // 注意不要忘 / 下写,会权限不够 #! /bin/bash case $1 in "Active") curl -s http://192.168.13.222/status | awk 'NR==1{print $3}';; "Accept") curl -s http://192.168.13.222/status | awk 'NR==3{print $1}';; "Waiting") curl -s http://192.168.13.222/status | awk 'NR==4{print $6}';; esac [root@localhost ~]# ./status_nginx.sh Active 1 [root@localhost ~]# ./status_nginx.sh Waiting 0 [root@localhost ~]# ./status_nginx.sh Accept 8 vim /etc/zabbix/zabbix_agent2.conf UnsafeUserParameters=1 Include=/etc/zabbix/zabbix_agent2.d/*.conf vim /etc/zabbix/zabbix_agent2.d/a.conf UserParameter=get_status_nginx[*],/home/status_nginx.sh $1 systemctl restart zabbix-agent2 [root@localhost ~]# zabbix_get -s 192.168.13.222 -k get_status_nginx[Active] 1
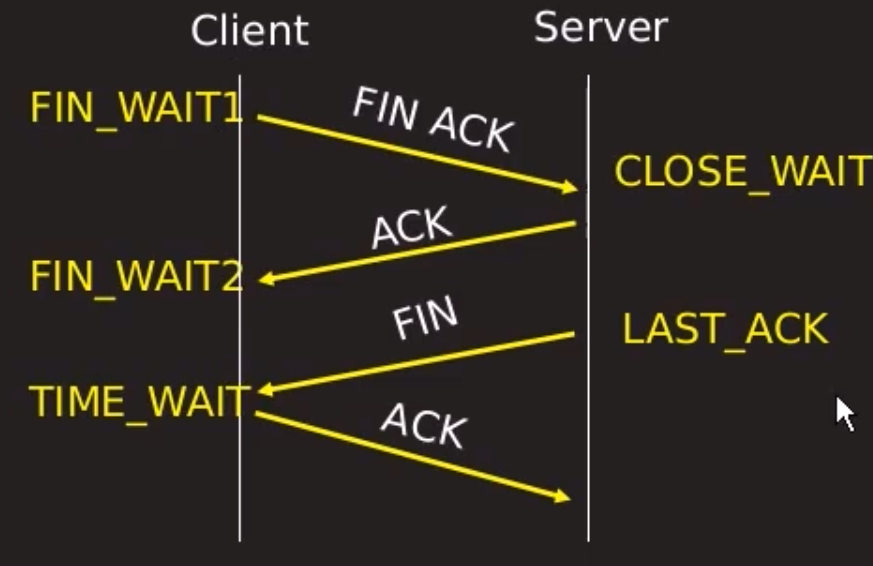
# 网络连接状态监控1 2 3 4 5 6 7 8 9 10 11 12 13 14 15 16 17 18 19 20 21 22 vim /home/tcp_status.sh #! /bin/bash case $1 in "estab") ss -antp | awk 'BEGIN{x=0}/^ESTAB/{x++}END{print x}';; "time_wait") ss -antp | awk 'BEGIN{x=0}/^TIME-WAIT/{x++}END{print x}';; "listen") ss -antp | awk 'BEGIN{x=0}/^LISTEN/{x++}END{print x}';; esac [root@localhost home]# chmod +x tcp_status.sh vim /etc/zabbix/zabbix_agent2.d/a.conf UserParameter=get_tcp_status[*],/home/tcp_status.sh $1 [root@localhost ~]# zabbix_get -s 192.168.13.222 -k get_tcp_status[estab] 2 [root@localhost ~]# zabbix_get -s 192.168.13.222 -k get_tcp_status[time_wait] 14
https://blog.csdn.net/DiKL_Y/article/details/131554359
https://blog.csdn.net/qq_27546717/article/details/117808148
https://zhuanlan.zhihu.com/p/677745300
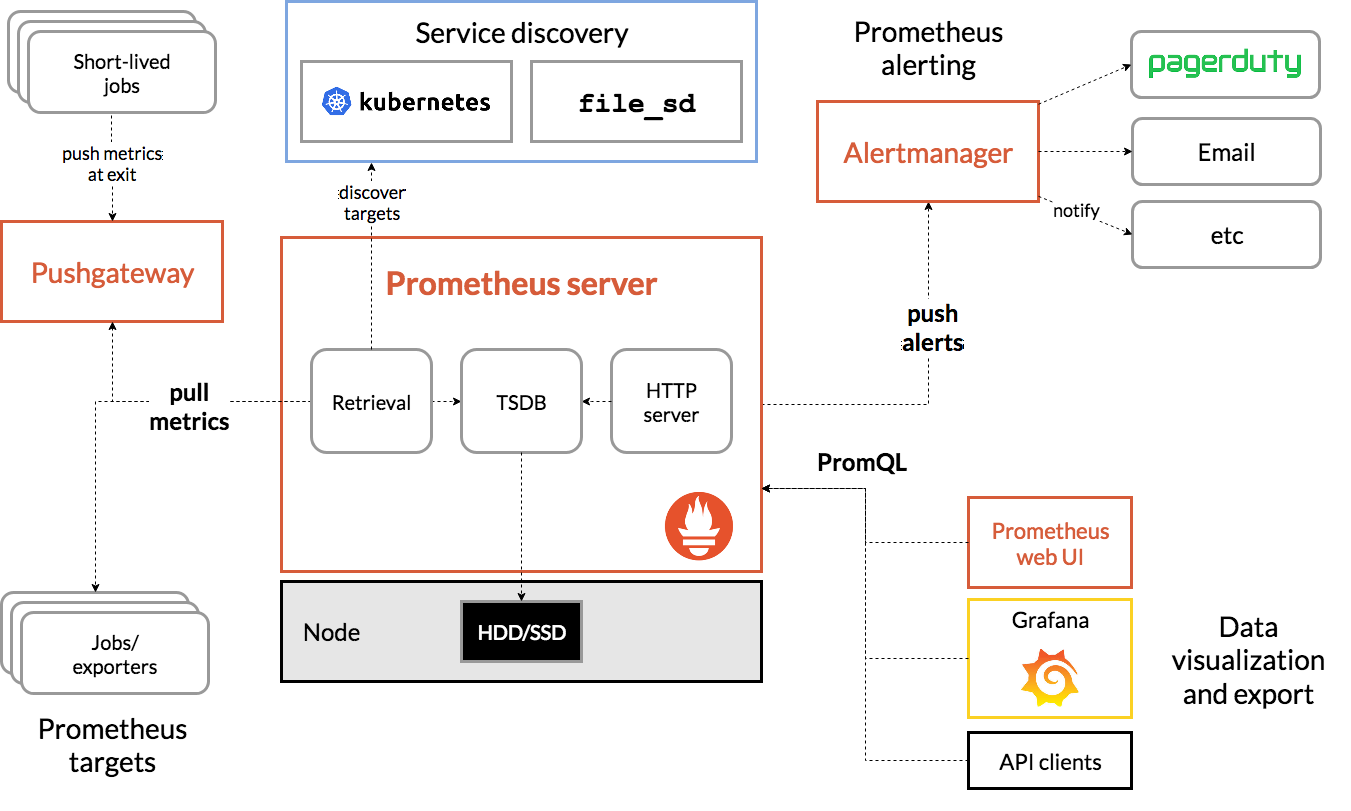
# prometheus# 组件
# ComponentsThe Prometheus ecosystem consists of multiple components, many of which are optional:
the main Prometheus server which scrapes and stores time series data
client libraries for instrumenting application codea push gateway for supporting short-lived jobs
special-purpose exporters for services like HAProxy, StatsD, Graphite, etc.
an alertmanager to handle alerts
various support tools
Most Prometheus components are written in Go , making them easy to build and deploy as static binaries.
prometheus 本身是一个以进程方式后动,之后以多进程和多线程实现监控数据收集 计算 查询 更新 存储 的这样一个 C/S 横型运行模式
1 2 3 4 5 wget https://github.com/prometheus/prometheus/releases/download/v2.52.0/prometheus-2.52.0.linux-amd64.tar.gz tar xzvf prometheus-2.52.0.linux-amd64.tar.gz cd prometheus-2.52.0.linux-amd64/ nohup ./prometheus &
默认监听 9090 端口
prometheus 平时是将采集过来的数据 先都存放在内存之中 (prometheus 对内存的消耗,还是不小的) 以类似缓存的方式,用于加快搜索和访问
# 采集方式:pull: 指的是 客户端 (被监控机器) 先安装各类已有 exporters 之后,exporters 以守护进程的模式 运行 并 开始采集数据
prometheus 用 pull 这种主动拉的方式 (HTTP get) 去访问每个节点上 exporter 并采样回需要的数据
push:指的是 在客户端 (或者服务端) 安装这个官方提供的 pushgatewvay 插件
# metricspromethes 监控中 对于采集过来的数据 统一称为 metrics 数据
Gauges:最简单的度量指标,只有一个简单的返回值,或者叫瞬时状态,例如,我们想衡量一个待处理队列中任务的个数
Counters:Counter 就是计数器,从数据量 0 开始累积计算 在理想状态下 只能是永远的增长 不会降低
Histograms
Histogram 统计数据的分布情况。比如最小值,最大值,中间值,还有中位数,75 百分位,90 百分位,95 百分位,98 百分位,99 百分位,和 99.9 百分位的值 (percentiles)。
近似百分比估算数值
1 2 3 4 5 6 7 8 9 10 11 12 13 14 15 16 17 18 19 20 21 22 root@k8s-master:~ go_gc_duration_seconds{quantile="0" } 1.298e-05 go_gc_duration_seconds{quantile="0.25" } 4.7067e-05 go_gc_duration_seconds{quantile="0.5" } 5.6978e-05 go_gc_duration_seconds{quantile="0.75" } 9.3503e-05 go_gc_duration_seconds{quantile="1" } 0.01176682 go_gc_duration_seconds_sum 0.030605689 go_gc_duration_seconds_count 49 go_goroutines 31 go_info{version="go1.22.3" } 1 go_memstats_alloc_bytes 5.096408e+07 go_memstats_alloc_bytes_total 3.27338656e+08
https://prometheus.io/download/
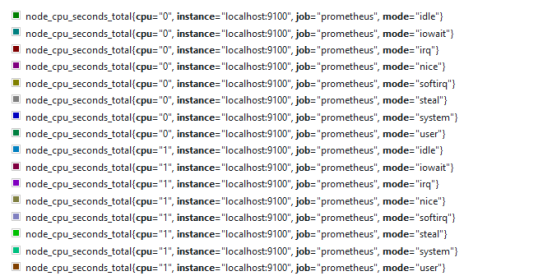
提供了大量的 expoert,最常用 node_exporter 可以列出 linux 系统中自身相关的监控数据
pushgateway 本事也是一个 http 服务器
通过自己写脚本搞监控数据,推送到 pgw,再由 pgw 推送到 pro
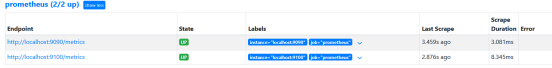
1 2 3 4 5 6 7 8 9 10 11 12 13 14 15 16 17 18 19 20 21 22 23 24 25 26 27 28 29 global: scrape_interval: 15s evaluation_interval: 15s alerting: alertmanagers: - static_configs: - targets: rule_files: scrape_configs: - job_name: "prometheus" static_configs: - targets: ["localhost:9090" ,"localhost:9100" ]
安装 node_exported 之后还需要去 target 中添加
prometheus server 9090。node_exporter 9100
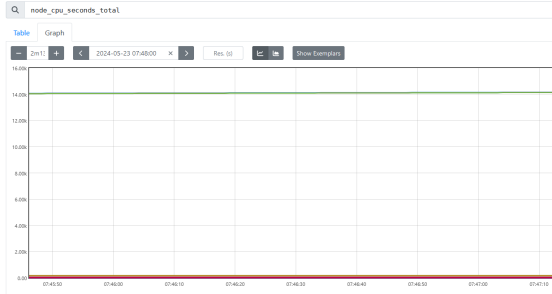
CPU 时间:从操作系统开启算起 CPU 就开始工作了并记录自己在工作中总共使用的 "时间" 的累积量把它保存在系统中
CPU 使用率 最准确的定义其实是 CPU 各种状态中除了 idle (空闲) 这个状态外,其他所有的 CPU 状态的加合 / 总 CPU 时间
increase()
针对 Counter 这种持续增长的数值,截取其中一段时间的增量
increase(node_cpu_seconds_total[1m])
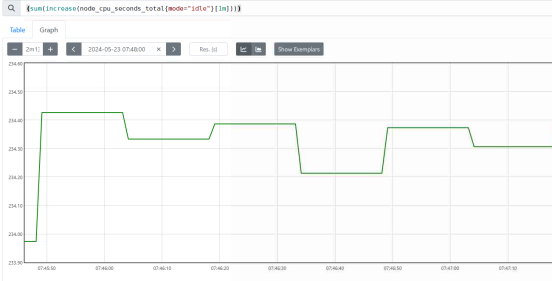
sum(increase(node_cpu_seconds_total[1m]))
把 cpu 所有核累加,把结果集累加
1 分钟以内,所有 cpu 核 mode 为 idle 状态
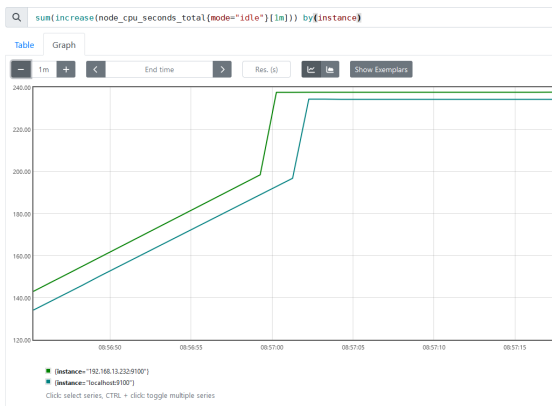
sum(increase(node_cpu_seconds_total{mode=“idle”}[1m]))
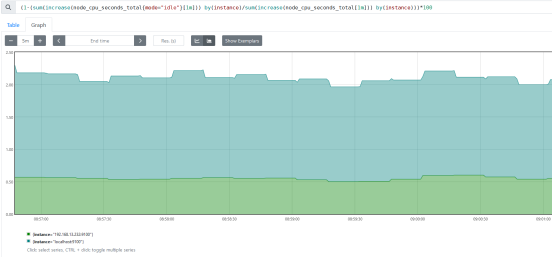
(1-(sum(increase(node_cpu_seconds_total{mode=“idle”}[1m])) by(instance)/sum(increase(node_cpu_seconds_total[1m])) by(instance)))*100
用户态
(sum(increase(node_cpu_seconds_total{mode=“user”}[1m])) by(instance)/sum(increase(node_cpu_seconds_total[1m])) by(instance))
=~ 模糊匹配
node_netstat_TcpExt_TCPTimeouts
过滤数值
node_netstat_TcpExt_TCPTimeouts{instance=~“192.168.13.*:9100”, job=“prometheus”} > 50
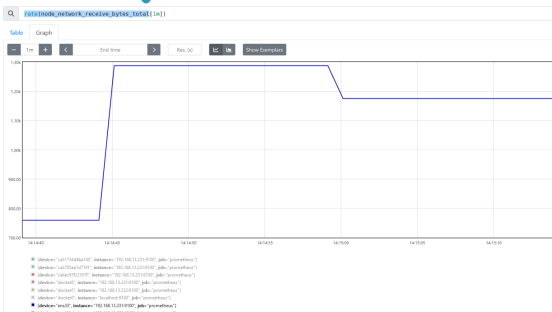
rate
用于搭配 counter 类型数据,根据时间段,取平均每秒增量
increase 取一段时间增量的总量
rate 数值 * 60s = increase 数值。 在 1 分钟范围时
sum() by (instance)
sum () by (cluster_name) cluster_name 需要自定义标签
topk (2,wait_connect) 取前 n 数值,gauge 数值
topk (2,rate (wait_connect)) 取前 n 数值,counter 类型
Topk 因为对于每一个时间点 都只取前三高的数值
topk 一般用作瞬时告警
count 数值条件匹配的进行累加
count(iowait>1)
后台运行 screen
screen
screen -r 111
screen -ls
ctrl + a + d
daemonize
1 2 3 4 5 6 7 8 9 10 11 12 13 14 15 16 17 18 19 20 21 22 23 24 25 26 27 28 wget https://github.com/bmc/daemonize/archive/refs/tags/release-1.7.8.tar.gz tar xzvf release-1.7.8.tar.gz cd daemonize-release-1.7.8/ apt install gcc zlib* pcre* make -y ./configure make && make install daemonize -c /root/prometheus-2.52.0.linux-amd64/ /root/prometheus-2.52.0.linux-amd64/prometheus # 防止空闲等待链接太多 --web.read-timeout=5m # 最大连接数 --web.max-connections=512 #数据保留期限 --storage.tsdb.retention=15d # 存储路径 --storage.tsdb.path="data/" # 优化查询 --query.timeout=2m --query.max-concurency=20 文件夹中字母目录是历史数据保留 近期数据在内存中,并且按照一定间隔放在wal中
pushgateway
它是可以单独运行在 任何节点上的插件 (并不一定要在被监控客户端)
通过用户自定义开发脚本 把需要监控的数据发送给 pushgateway
pushgateway 再把数据推送给 prometheus server
1
2
3
4
5
6
7
8
9
10
11
12
13
14
15
16
17
wget https://github.com/prometheus/pushgateway/releases/download/v1.8.0/pushgateway-1.8.0.linux-amd64.tar.gz tar xzvf pushgateway-1.8.0.linux-amd64.tar.gz nohup ./pushgateway & vim prometheus.yml scrape_configs: # The job name is added as a label `job=<job_name>` to any timeseries scraped from this config. - job_name: "prometheus" # metrics_path defaults to '/metrics' # scheme defaults to 'http'. static_configs: - targets: ["localhost:9090","localhost:9100","192.168.13.232:9100","192.168.13.231:9100"] - job_name: "pushgateway123" static_configs: - targets: ["localhost:9091","localhost:9092"]
1
2
3
4
定义push内容 label="count_wait_connection" count_wait_connection=`netstat -lntupa|grep -i wait| wc -l` echo "$label:$count_wait_connection" | curl --data-binary @- http://192.168.13.230:9091/metrics/job/pushgateway123/instance/$instance_name
将 HTTP POST 请求中的数据发送给 HTTP 服务器 (pushgateway),与用户提交 HTML 表单时浏览器的行为完全一样。
pushgateway 会形成一个单点瓶颈,假如好多个 脚本同时发送给一个 pushgateway 的进程如果这个进程没了,那么监控数据也就没了
pushgateway 并不能对发送过来的 脚本采集数据 进行更智能的判断 假如脚本中间采集出问题了那么有问题的数据 pushgateway 一样照单全收 发送给 prometheus
不同于 pushgateway,exporter 是一个独立运行 的采集程序
自身是 HTTP 服务器,可以响应 从外发过来的 HTTP GET 请求
自身需要运行在后台,并可以定期触发 抓取本地的监控数据
返回给 prometheus_server 的内容 是需要符合 prometheus 规定的 metrics 类型 (Key-Value)
(1-(sum(increase(node_cpu_seconds_total{mode=“idle”}[1m])) by(instance)/sum(increase(node_cpu_seconds_total[1m])) by(instance)))*100
(1-((node_memory_Buffers_bytes+node_memory_Cached_bytes+node_memory_MemFree_bytes)/node_memory_MemTotal_bytes))*100
(rate(node_disk_read_bytes_total[1m])+rate(node_disk_written_bytes_total[1m]))/1024/1024
(node_filefd_allocated/node_filefd_maximum)*100
root@k8s-node2:~# timeout 5 ping -q -A -s 500 -W 1000 -c 100 192.168.13.230
— 192.168.13.230 ping statistics —
root@k8s-node2:~# timeout 5 ping -q -A -W 1000 -c 100 192.168.13.230
— 192.168.13.230 ping statistics —
1
2
3
4
root@k8s-node2:~# timeout 5 ping -q -A -s 500 -W 1000 -c 100 192.168.13.230 | grep transmitted | awk '{print $6}' 0% root@k8s-node2:~# timeout 5 ping -q -A -s 500 -W 1000 -c 100 192.168.13.230 | grep transmitted | awk '{print $10}' 10ms